Eugene Fama, the 2014 co-recipient of the Nobel Prize in Economics and father of the efficient market hypothesis, and his equally well-credentialed co-author, Ken French, have summarized the academic research on momentum as follows:(1)
The premier anomaly is momentum.
Fama, E. and K. French, 2008, Dissecting Anomalies, The Journal of Finance, 63, pg. 1653-1678.
Professors Fama and French make this statement because the empirical research on the momentum effect is clear: Pre-transaction costs, winners tend to keep winning, and losers tend to keep on losing.(2)
As natural skeptics, we have independently verified many of the empirical results associated with momentum. Momentum is well-grounded, historically. While we never want to invest in a strategy simply because it has a great backtest, we believe the momentum anomaly is a sustainable active investment strategy. We believe the strategy can persist for the same reasons we believe value investing returns are persistent:
- Higher returns generally come with higher risks
- Human beings are not always hyper-rational, which means prices aren’t always perfect
We minimize deeply ingrained human bias by following a systematic approach to security selection, which protects us from our behavioral errors. Our tools do not necessarily need to be complex, but they do need to be systematic. We contend with volatility and career risk by educating investors on the long-term horizon required to be a successful momentum investor. We refuse to appease those seeking to avoid career risks by “diluting” our Quantitative Momentum Index and turning it into a closet one.(3) Our strategy is concentrated and follows an evidence-based methodology. In the end, we cannot guarantee long-term success, but our index process does promise one thing: a high-conviction momentum strategy that seeks to do the following:
Buy Stocks with the Highest Quality Momentum.
Note: For those who want to dive into the specifics of the Quantitative Value Indexes, please visit our index website.
An Introduction to the Quantitative Momentum Index
Our Quantitative Momentum (QM) process has a straightforward mission:
- Identify the most effective way to capture the momentum premium.
Our mission involves three core beliefs:
- Momentum investing works, in part, because the strategy is high risk (higher risks generally lead to higher returns).
- Momentum investing works, in part, because of an underreaction to positive fundamentals that can lead to mispricing.(4)
- To extract the most benefits from the momentum premium, the portfolio needs to be focused (i.e., 50 stocks or less) and not a closet index.
We document our complete research findings in the book, Quantitative Momentum.
The book has been well received by the investment community and serves as a one-stop-shop for those looking to learn more about how to deploy momentum in the context of stock selection.(5)
How Did A Group of Value Investors Find Momentum?
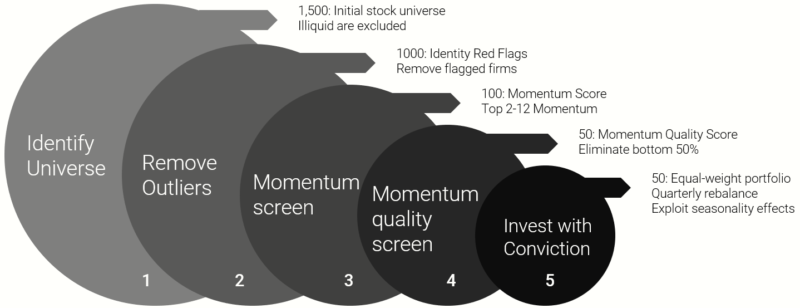
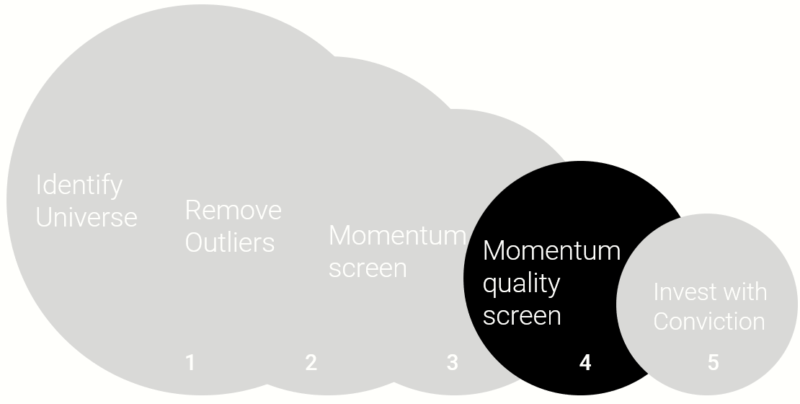
In 2012, Alpha Architect partnered with a multi-billion dollar family office and turned our dream to deliver affordable alpha into a reality. At the time, we were focused on our Quantitative Value strategy. However, during our extensive research and development efforts, we created a momentum strategy that complemented our value strategy.(6) Below is the process we settled upon (Note: we focus on the US version of the index in this piece, but we apply our technology in other markets as well).(7) Our momentum process is broken into five sequential steps:
- Identify Universe: Our universe generally consists of the largest 1500 liquid U.S. exchange-traded stocks.
- Remove Outliers: We leverage algos derived from academic research to eliminate stocks with red flags.
- Screen for Momentum: We screen for stocks with the strongest momentum. (Top 100 stocks)
- Screen for Momentum Quality: We seek high-quality momentum action less dependent on large return gaps. (Top 50 stocks)
- Investment with Conviction: We seek to invest in a concentrated portfolio of stocks with the highest quality momentum. This form of investing requires disciplined commitment and a willingness to deviate from standard benchmarks.
A visual depiction of our process:
Step 1: Identify the Investable Universe
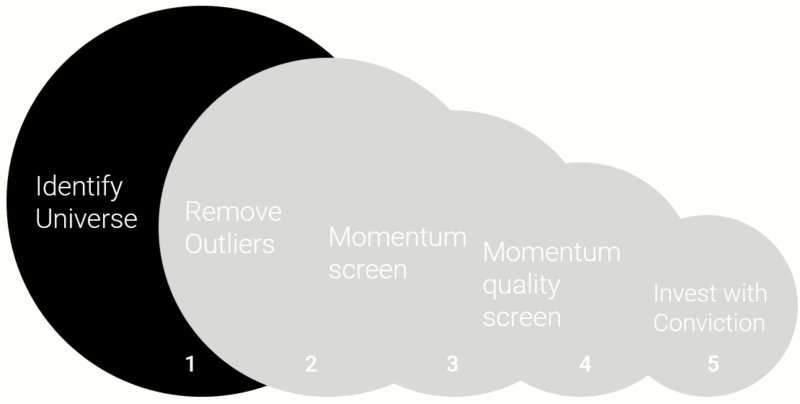
The first step in the QM investing process involves setting boundaries on the universe for further screening. There are several reasons we place such limits around the stocks to consider. A critical aspect involves liquidity, which is related to the size of the stocks under consideration. In general, if we include stocks that are too small, the possibility of large price moves on small volumes can lead to significantly overstated theoretical returns relative to actual returns. In other words, if we include micro-caps and smaller stocks in our universe, the back-tested results may generate phenomenal returns, but these returns may be unobtainable in the real world, even when operating with small amounts of capital.
To honestly assess and reliably implement the QM approach, we focus on the largest 1,500 stocks in our universe. Our universe excludes ADRs, REITs, ETFs, and firms without 12 months of return data. In addition, we eliminate firms in the bottom 15% based on liquidity (e.g., Average Daily Volume). Our investment universe contains liquid companies with at least one year of return data.
Step 2: Remove Outliers
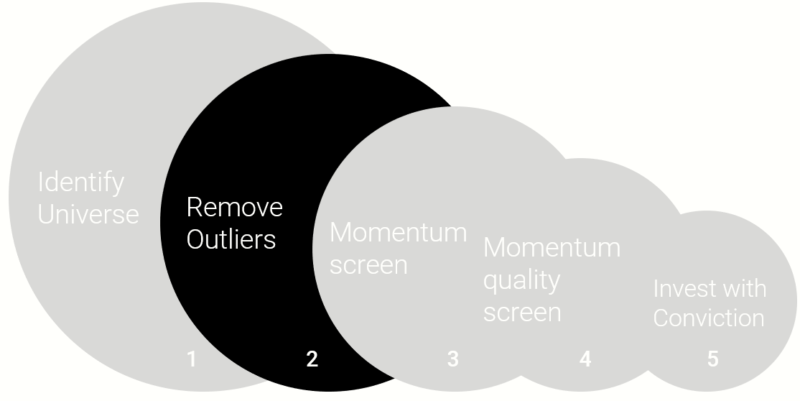
Academic research suggests that not all stocks are created equal — some stocks have higher expected returns, and others have lower expected returns. While our momentum system seeks to identify stocks with the best momentum (see steps 3 and 4 below), our initial “outlier” screens seek to avoid stocks with poor attributes.
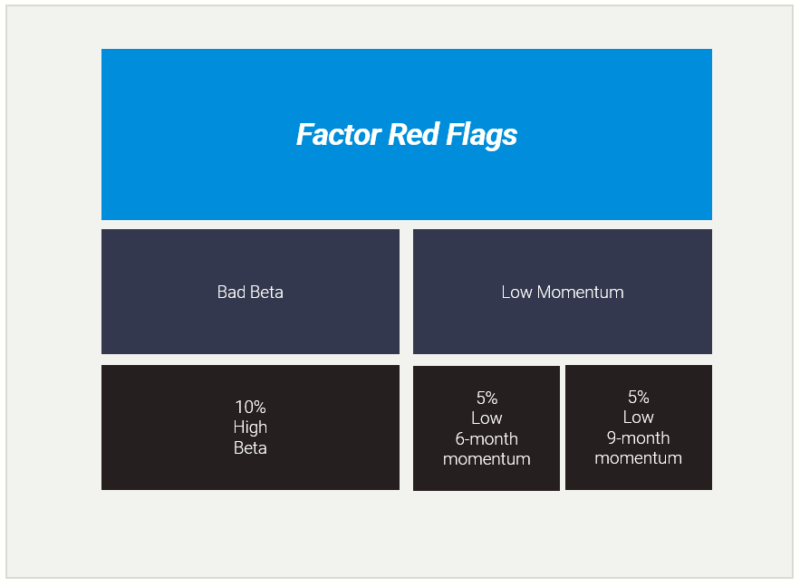
To achieve this goal, we lean on several factor red flags:
First, we seek to avoid extremely high beta stocks. These stocks have been identified as long-term losers in academic research. And if we can prevent landmines at the outset, why not? To achieve our objective we eliminate the 10% of our universe with the highest betas.
Next, we focus on momentum characteristics. Our goal is to identify momentum winners, so at the outset, if we can identify obvious momentum losers, we should eliminate these stocks from our sample universe. In order to achieve this objective, we eliminate firms in the lowest 5% of our universe on either the 6-month or 9-month momentum measures. The desired outcome of this screen is to avoid situations where our momentum system identifies a stock with favorable momentum characteristics, but the momentum characteristics for other common metrics are terrible. (e.g., great 2-12 momentum, terrible 9-month momentum).
A visual depiction of our remove outliers step is outlined below:
Step 3: Momentum Screen
In basketball, if a player has made a few shots in a row, the player is described as having a “hot hand;” in finance parlance, this player has “momentum.” But can basketball players actually exhibit momentum? Initially, the evidence rejected such a theory, as outlined in a 1985 paper by Thomas Gilovich, Robert Vallone and Amos Tversky.(8)
The theory of a hot hand in sports was considered a myth for decades. The question appeared settled. However, recent working papers by Andrew Bocskocsky, John Ezekowitz and Carolyn Stein in 2013(9), and Brett S. Green and Jeffrey Zwiebel in 2013(10), now shows that the hot hand probably exists in basketball and baseball.
The intellectual journey to identify momentum in sports is similar to the attempts to identify momentum in stocks. Initially, stock momentum was deemed a myth because the efficient market hypothesis considered this approach to be impossible. Academics laughed at the idea. But contravening evidence began to mount…and mount…and mount. Today, no one is laughing. Serious evidence-based investors and academic researchers can no longer consider momentum heresy.
But how does one calculate momentum?
When testing momentum in stock returns, we first need to identify the period over which we will calculate the momentum variable. Below, we summarize the main academic research findings for three different look-back momentum calculation periods:
- Short-Term Momentum (1-month) – exhibits a reversal in returns
In short, both short-term and long-term momentum signal a future reversal in returns. In other words, one can expect these stocks to underperform. However, intermediate-term momentum provides a continuation of returns−the so-called “hot-hand.” We focus on this widely studied and well-established momentum measurement for Step 3.
A simple hypothetical image to describe the intermediate-term momentum strategy can be found below:
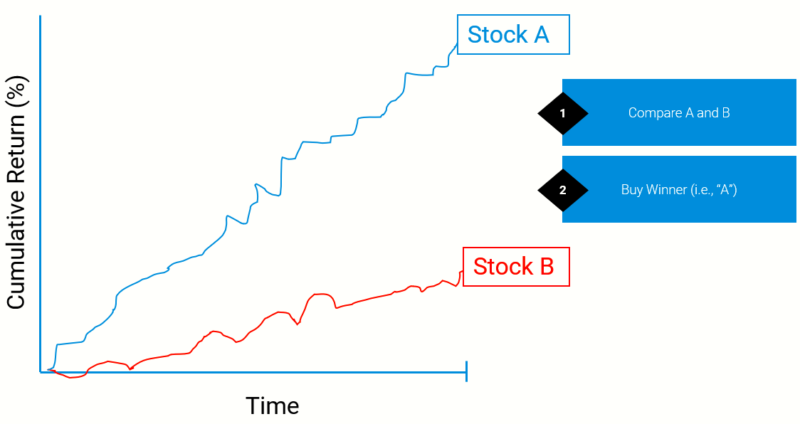
Analysis of the performance of this stand-alone metric is available in the footnotes.(11)
Step 4: Momentum Quality Screen
Step 1 helps us identify a universe that is expected to be reasonably liquid, and step 2 screens out stocks with potential issues. Step 3 helps us identify the top 100 momentum names for further consideration. The next step, Step 4, helps us identify the top 50 momentum winners that we believe will continue to have the best momentum in the future.
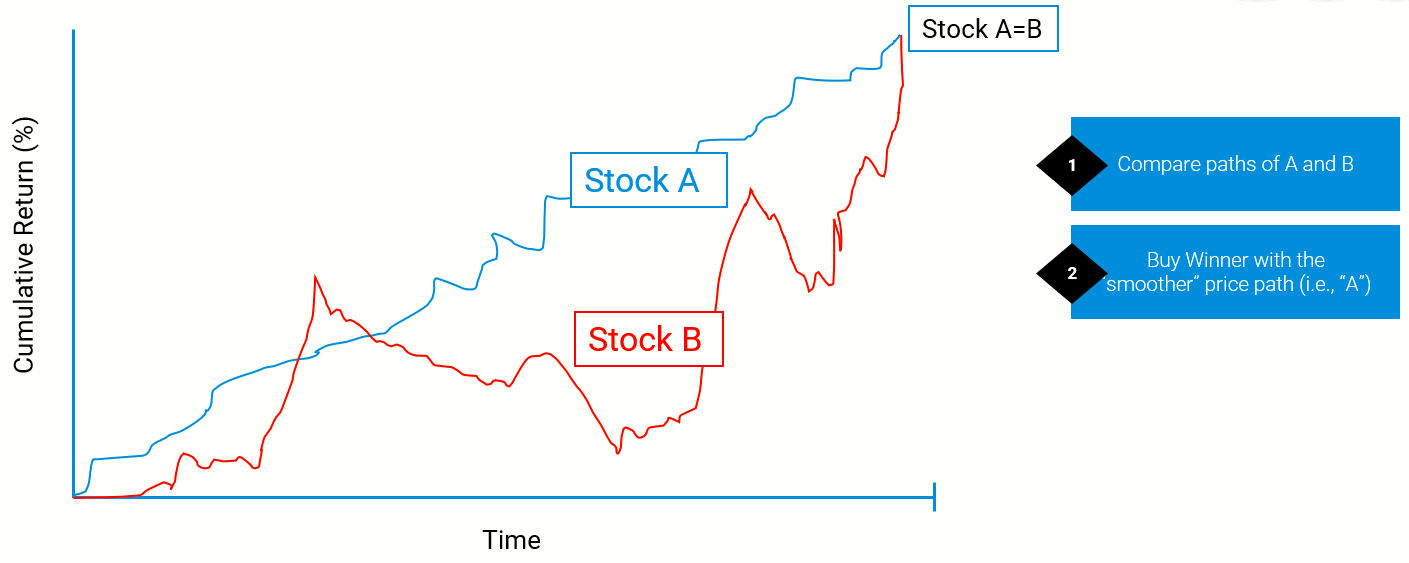
The details for calculating momentum quality are complex, but the intuition is simple. Consider two hypothetical momentum stocks: Stock B is a biotechnology company, Stock A is a Big Box Store, and both companies have a 200% return over the past 12 months. However, assume A and B have vastly different paths to 200 percent returns.
- Buzzing Biotech: Stock B’s returns were 0% for 11 months, but just recently, Stock B was granted FDA approval for a new drug, and the stock shot up 200%.
- Boring BigBox: Stock A has returned 0.80% each day, on average, for the past 250 days and has generated a 200% return.
Stock B and Stock A are considered momentum stocks, but Buzzing Biotech’s path is much different from Boring BigBox’s. So-called “path dependency” matters if momentum is driven by an investor bias called “limited attention.” For example, Buzzing Biotech’s FDA approval will likely be covered by the media and be highly available to investors, thus rapidly driving the company’s price to efficient levels. However, Boring BigBox is delivering news that is consistently better than market expectations over a longer period, and because the attention to Boring BigBox is limited, this good news is slow to be incorporated into market prices.
Below, we graphically depict a hypothetical example of 2 “high” momentum stocks.(12)(13)
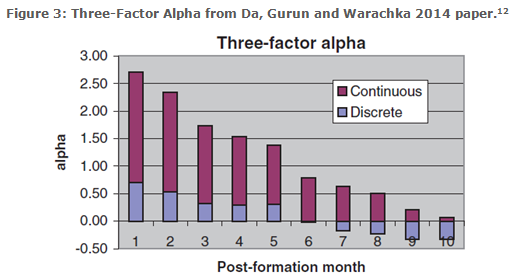
Although testing the “limited attention” hypothesis in the context of momentum is challenging, we’re lucky that finance professors have been hard at work. In a 2014 paper titled, “Frog-in-the-Pan: Continuous Information and Momentum,” Zhi Da, Umit Gurun, and Mith Awarachka find that high momentum firms with smooth, or “high-quality” continuous momentum, tend to do better than those firms with choppy low-quality discrete momentum. The results are summarized in Figure 3, which shows three-factor alpha estimates for long/short high-quality (“continuous”) and low-quality (“discrete”) momentum portfolios over various rebalance frequencies.(14)(15)
Recall that the proverbial frog-in-the-pan sits in a pool of water whose temperature is gradually increasing. Because the change in temperature is so slow, the frog has limited attention to the rising heat and he slowly boils to death. Similarly, investors have limited attention to the ongoing flow of uneventful, but reliable information, arriving continuously in small amounts regarding a stock.
To calculate “frog-in-the-pan” momentum, the authors classify each daily return as either positive or negative (or zero in some cases). Generally, a high-quality momentum stock should have a higher percentage of positive return days than a choppier stock.(16)
Finally, we sort our high momentum 100 stock universe from step 3 on our “frog-in-the-pan” momentum quality metric to identify a 50 stock universe of what we believe are the stocks with the highest quality momentum.
Step 5: Invest with Conviction

Steps 1 through 4 systematically identify stocks we believe have the highest quality momentum. Our approach to momentum investing intelligently incorporates the best research on the subject into a coherent and pragmatic investment approach. But we can easily destroy the benefits of a reasonable investment process by mismanaging portfolio construction and “diworsifying” our active momentum exposure. We have a more extensive write-up on this problem in our Quantitative Value white paper, but Charlie Munger, at the 2004 Berkshire Hathaway Annual Meeting, sums up the problem nicely:
The idea of excessive diversification is madness…almost all good investments will involve relatively low diversification.
Charlie Munger is right: to the extent, you believe you have a reliable method of constructing a high alpha “active” portfolio, less diversification is desirable.
In the spirit of Munger’s sage advice, we construct our portfolios to hold around 50 securities, on average. This approach is atypical in our experience — many momentum portfolios we see consist of 100’s of stocks and are designed to have minimal benchmark tracking risk. In short, the portfolio designer is less concerned with capturing the momentum factor and more concerned with tracking a benchmark index.
Consider our typical process:
- Identify Investable Universe: We start with 1500 names in this step of the process.
- Red Flag Screens: We usually end up with around 1000 stocks.
- Momentum Screen: Here we screen for the top 100 momentum stocks in the universe.
- Momentum Quality Screen: Our momentum quality screen identifies the top 50 stocks with the highest quality momentum.
- Invest with Conviction: We invest in our basket of 50 stocks that have the highest quality momentum.
Our Quantitative Momentum Index has the following construction details:
- Equal-weight construction
- 20% industry constraint for the (1) U.S. and (2) International indices(17)
- Pre-trade liquidity requirements
- Quarterly rebalanced
Note. We have an extended conversation on “when” we rebalance in the footnotes.(18)
We don’t like to emphasize historical performance because we believe the process is paramount and who hasn’t seen a beautiful backtest?(19) But one can be sure that if they construct a portfolio with a high active share this portfolio will likely endure high tracking error and bounce around the benchmark (sometimes positively, but sometimes negatively). Unfortunately, we cannot build portfolios that “beat the market” on a consistent basis, but we do think we can build portfolios that can win over the long-haul.
Why Isn’t Everyone a Concentrated Systematic Momentum Investor?
We believe our Quantitative Momentum Index process is evidence-based and has a chance to outperform the market over the long-haul on a risk-adjusted basis. But while all of this may sound promising, one must consider a simple question:
If this is so easy, why aren’t all investors doing it?
In addition to the fact that building and implementing a momentum portfolio is non-trivial, there are two key reasons why our approach to momentum is simple but challenging:
- Momentum investing is inherently more volatile than passive equity investing.
- High-conviction momentum investing is loaded with career risks and the chance of suffering long stretches of relative underperformance.
Many professionals shy away from momentum investing because the return path is volatile and deviations from standard benchmarks are extreme. Over the long-term, we estimate that the volatility of our Quantitative Momentum strategy will be at least 25% higher than that of the general stock market.
But the pain doesn’t end there, the Quantitative Momentum Index is designed to be very different from the passive indexes. The tracking error of the Quantitative Momentum Index versus the S&P 500 will be large. In other words, prepare for major deviations from standard benchmarks and multiple opportunities to get fired as an asset manager.
The ability to withstand short-term pain is required to pursue a high-conviction momentum strategy, but we believe the potential reward of higher returns can be worth it for a disciplined investor.
Conclusion Regarding Our Quantitative Momentum Process
In the short-run, most of us cannot endure the pain that momentum investing strategies impose on our portfolios and our psyches. It is simply too difficult. Furthermore, for those in the investment advisory business, providing a strategy with the potential for multi-year underperformance is akin to career suicide.(20)
And yet, at Alpha Architect, we explicitly focus on a high-conviction momentum investing philosophy because the evidence for outperformance is so striking and robust. Why would we risk such career suicide? We hope to educate investors with the appropriate temperament on what it takes to achieve long-term investment success as a momentum-investor. It is not easy, and it is not for everyone, but for those rare souls who understand the discipline required, our systematic momentum investment process allows investors to “follow the model” and avoid behavioral biases that can poison even the most professional and independent fundamental momentum investors.
Buy Stocks with the Highest Quality Momentum
Wesley R. Gray and Jack R. Vogel, co-CIOs Alpha Architect
Information on our Quantitative Momentum Indexes is available here.
References[+]
| ↑1 | Fama, E. and K. French, 2008, Dissecting Anomalies, The Journal of Finance, 63, pg. 1653-1678. |
|---|---|
| ↑2 | Geczy, C. and M. Samonov, 212 Years of Price Momentum, University of Pennsylvania Working Paper, accessed 10/31/2015 |
| ↑3 | a term used to describe strategies that claim to actively purchase investments but wind up with a portfolio not much different from the benchmark. |
| ↑4 | And perhaps an eventual overreaction driven by overconfidence and short-sell constraints |
| ↑5 | The recommendations are directed towards the book’s quality and are not an endorsement of advisory services provided by Alpha Architect, LLC or affiliates. Alpha Architect does not know if the recommenders approve or disapprove of its services. The recommendations were chosen from a list of formal recommendations based on if the author had a Ph.D. or not.
|
| ↑6 | We shifted from a value-based religion to an evidence-based religion. |
| ↑7 | All materials below have been updated as of 11/23/2020 to reflect the official updates to our indexes. |
| ↑8 | Gilovich, E., R. Vallone, and A. Tversky, 1985, The Hot Hand in Basketball: On the Misperception of Random Sequences, Cognitive Psychology, 17, pg. 295-314. |
| ↑9 | Bocskocsky, A., J. Ezekowitz, and C. Stein, 2014, The Hot Hand: A New Approach to an Old “Fallacy”, working paper, accessed 11/15/15 |
| ↑10 | Green, B. S., and J. Zwiebel, 2015, The Hot-Hand Fallacy: Cognitive Mistakes or Equilibrium Adjustments? Evidence from Major League Baseball, working paper, accessed 11/15/15 |
| ↑11 | To examine how momentum portfolios have performed historically, we use Ken French’s publicly available data in our book (here is a link to the data description). The results shown below are gross of any fees and run from 1/1/1927 to 12/31/2014, and examine the value-weight returns to the top and bottom decile momentum portfolios formed every month on their cumulative 12-month past returns, ignoring the last month (a.k.a.12_2 momentum). Note: we exclude last month’s returns to minimize the short-term momentum reversal effect.
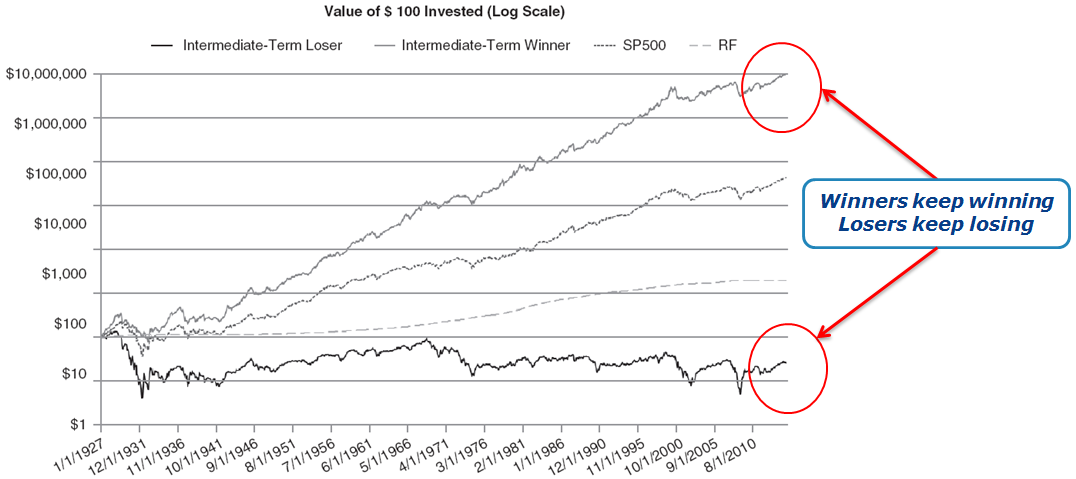 https://alphaarchitect.com/wp-content/uploads/2015/12/Quantitative-Momentum-4.png 1076w" sizes="(max-width: 1076px) 100vw, 1076px" /> https://alphaarchitect.com/wp-content/uploads/2015/12/Quantitative-Momentum-4.png 1076w" sizes="(max-width: 1076px) 100vw, 1076px" />Big picture — buying the highest momentum stocks over the past nine decades was a great idea (on paper!). Note that the low-momentum decile portfolio had a negative return over the same period. In general, the momentum premium decays as the rebalance frequency decreases, as we highlight here (e.g., monthly rebalanced portfolios beat annually rebalanced portfolios). However, costs increase with rebalance frequency. We highlight arguments regarding trading costs in a few blog posts here, here, and here. Thus, consistent with the law of diminishing returns, there is a point at which the momentum benefits of frequent rebalancing are overcome by costs. As a compromise, we examine a “sweet spot” 3-month rebalance for the portfolio analysis that employs overlapping portfolios. We use overlapping portfolios. An example of a 3-month hold portfolio would be as follows: on Jan 1, buy the top decile and hold until March 31; on Feb 1, buy the top decile and hold until April 30; on March 1, buy the top decile and hold until May 31. So the portfolio return during March would be the equal-weighted basket of the stocks added on Jan 1, Feb 1, and March 1. The image above shows that a generic momentum screen outperforms the passive market index based on annualized returns. However, a generic momentum portfolio also has more volatility and a larger drawdown. In the next step, we seek to identify techniques to minimize the extra volatility and drawdowns associated with momentum strategies. |
| ↑12 | Note, Stock B and Stock A in the illustration below are not “Buzzing BioTech” and “Boring BigBox” described above |
| ↑13 | Note — we are not great artists! |
| ↑14 | Da, Z., U. G. Gurun, and M. Warachka, 2014, Frog in the Pan: Continuous Information and Momentum, Review of Financial Studies, pp. 1-48. |
| ↑15 | Figure 3 also highlights that the alpha for a long/short momentum strategy decreases as the holding period increases (less rebalances). A similar result is found for long-only portfolios in many academic papers. |
| ↑16 | The exact variable used is ID = sign(momentum over past 12 months ignoring last month)*(%negative-% positive) |
| ↑17 | At the time of rebalancing, using NAICs 4-digit codes. 25% industry constraint for Canada. |
| ↑18 |
Seasonality Screen: Premiums Vary Over TimeOur Quantitative Momentum system incorporates seasonality effects documented in momentum strategy research. Some of the most compelling research on this subject is found in a 2007 paper titled, “Causes and Seasonality of Momentum Profits,” published in the Financial Analyst Journal by Richard Sias. Professor Sias shows that window-dressing (i.e., when institutions buy stocks that have performed well so they can report ownership of “winning” stocks for quarter-end reports) and tax incentives at year-end drive momentum seasonality effects. Professor Sias summarizes his results:
Sias’s paper focuses on long/short momentum portfolios, but the conclusions regarding momentum seasonality can be incorporated into our long-only Quantitative Momentum system. Below we show the spread between the high and low momentum portfolios month-to-month from 1/1/1927 – 12/31/2014, gross of any fees. We again use overlapping quarterly-rebalanced value-weight portfolios. We are showing the average monthly return to the difference between the high and low momentum portfolios (a long/short portfolio). 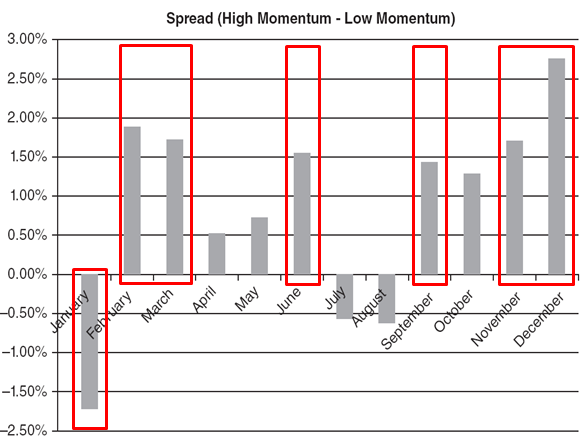 One notices that the spread between the high and low momentum portfolios is (in general) the highest in quarter-ending months (comparing the returns within each quarter). While the January finding in the paper is interesting (low momentum outperforms high momentum in January), attempting to trade on this can be challenging to implement. As such, we do not include this in our Quantitative Momentum screening methodology. |
| ↑19 | However, if you’d like to see the hypothetical performance we suggest you review our index educational materials, which are available here. |
| ↑20 | High conviction momentum can be combined with high conviction value strategies to help mitigate portfolio risk. |
About the Author: Jack Vogel, PhD
—
Important Disclosures
For informational and educational purposes only and should not be construed as specific investment, accounting, legal, or tax advice. Certain information is deemed to be reliable, but its accuracy and completeness cannot be guaranteed. Third party information may become outdated or otherwise superseded without notice. Neither the Securities and Exchange Commission (SEC) nor any other federal or state agency has approved, determined the accuracy, or confirmed the adequacy of this article.
The views and opinions expressed herein are those of the author and do not necessarily reflect the views of Alpha Architect, its affiliates or its employees. Our full disclosures are available here. Definitions of common statistics used in our analysis are available here (towards the bottom).
Join thousands of other readers and subscribe to our blog.