Any frequent reader of our blog knows we are fans of momentum investing. At this point, investment professionals should know that momentum historically works, that momentum is painful, and we have our own opinions on how to implement momentum investing via our Quantitative Momentum Index.
Sometimes we feel there is nothing new when it comes to momentum. However, a new momentum investing paper, “Overpriced Winners,” by Profs Kent Daniel, Alexander Klos, and Simon Rottke, is really cool and worth consideration.
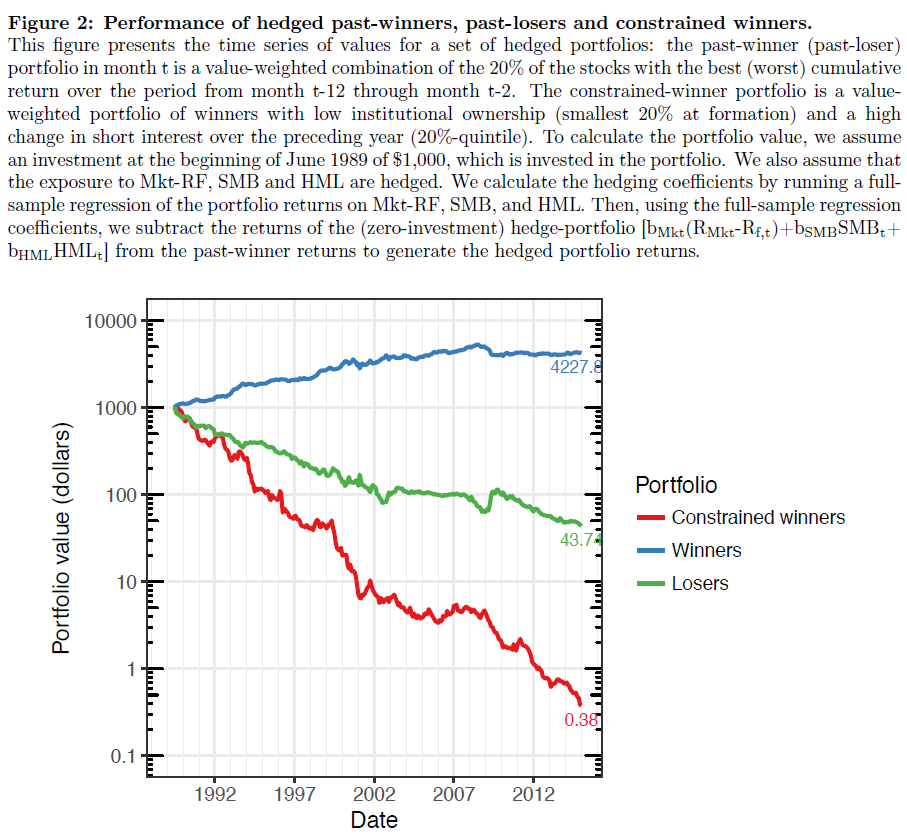
One key chart from the paper sums up everything:

The results are hypothetical results and are NOT an indicator of future results and do NOT represent returns that any investor actually attained. Indexes are unmanaged, do not reflect management or trading fees, and one cannot invest directly in an index. Additional information regarding the construction of these results is available upon request.
The chart shows that 12-2 momentum winners do well upon formation, 12-2 momentum losers do poorly (initially), and the market grinds along (we already know that).(1)But the chart also shows that “overpriced winners” are absolutely terrible.
Overpriced winners? Let’s dig in further!
What Are Overpriced Winners?
Within the high momentum portfolio (the “winners”), the authors examine a difference between what they classify as “constrained” and “unconstrained” firms. Specifically, the paper defines a “constrained” momentum firm using an independent triple sort. The authors split the universe into quintiles using the past 12_2 months returns (the stock’s momentum over the past year, ignoring the previous month). The additional two sorts are quintile ranks on (1) institutional ownership and (2) changes in short interest over the preceding year.
A “constrained” winner is a firm that is in the top quintile on 3 measures:
- Momentum
- Institutional Ownership (Low is more constrained)
- Change in Short Interest (High is more constrained)
Behavioral finance generally theorizes that the momentum anomaly is caused by investors suffering from an underreaction to firm news / fundamentals. (see here) ((2) However, for this subset of high momentum firms, the authors suggest a different behavioral bias at work — unwarranted optimism.
The logic is the following, in the author’s words:
… for the constrained winners, we argue that a possible source of the price rise was that only a subset of investors revised upward their valuation of the firm in response to what we will label a “sentiment” or “disagreement” shock. For an unconstrained firm, the price would not move appreciably in response to such a shock; the subset of now-optimistic investors affected by the sentiment shock would demand more shares, but in response the arbitrageurs (whose valuation of the firm was unaffected by this shock) would short the shares demanded by the optimists. However, for a constrained stock, where it is difficult for the arbitrageurs to borrow and short the stock, competition between the optimistic investors will lead to a strong, unwarranted price rise for the stock.
The authors highlight the performance of the three portfolios (winners, losers, and constrained winners) in Figure 2 below. The returns shown are associated with portfolios hedged against the market, size and value factors.(3)
The results are hypothetical results and are NOT an indicator of future results and do NOT represent returns that any investor actually attained. Indexes are unmanaged, do not reflect management or trading fees, and one cannot invest directly in an index. Additional information regarding the construction of these results is available upon request.
Figure 2 highlights that shorting, or ignoring the subset of “constrained” winners, is a good idea!
In the paper, the authors create a model to predict the investor behavior for this subset of stocks — here it is in the author’s words:
In our simplified setting, for unconstrained firms where the cost of locating shares to borrow is zero, a shock to disagreement or optimism has no effect on the price. Here, such shocks result in trading volume – the agents who become more optimistic buy shares from those who are more pessimistic – but the market clearing price remains constant. However, for firms where short selling is constrained (i.e., where it is costly to find shares to borrow) the more pessimistic agents choose not to short because of the high cost of finding shares to borrow. Thus, the market-clearing price no longer reflects the valuations of these newly “sidelined” pessimists, and moves upward. Hence, if we see that a constrained firm has experienced a large price rise over the last year, it is likely that disagreement for this firm has increased, which further implies that this firm is likely to earn low returns as the disagreement is resolved.
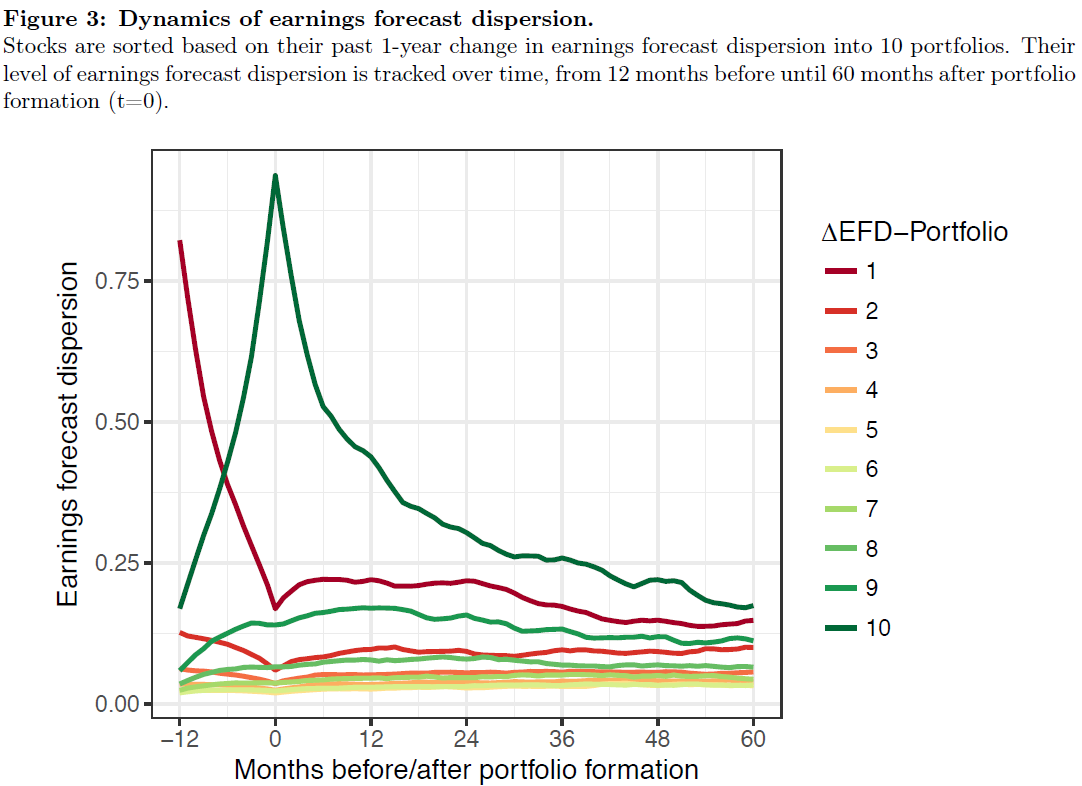
Figure 3 (below) graphs the deciles of earnings forecast dispersion over a 6-year period. Note that most of the dispersion deciles stay similar across time. Within Decile 10, one notices that there are firms with a large dispersion of earnings forecasts around portfolio formation. The authors use this in their model to highlight the following fact — for constrained firms, where the optimists are setting the price, they may need to bring their earnings estimates downward in the future– in a sense predicting lower returns while also lowering their forecasts.
The results are hypothetical results and are NOT an indicator of future results and do NOT represent returns that any investor actually attained. Indexes are unmanaged, do not reflect management or trading fees, and one cannot invest directly in an index. Additional information regarding the construction of these results is available upon request.
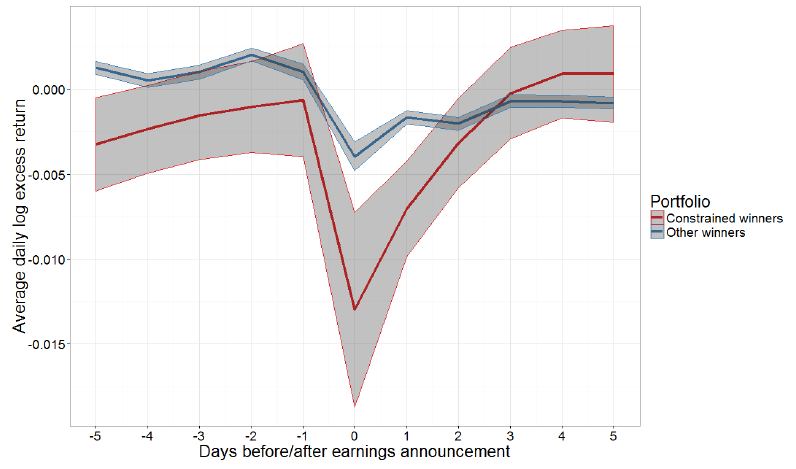
So far, we know that (1) we should short / avoid the constrained winners and (2) lower returns in the future may be predictable. The authors also test how these firms react around earnings announcements in Figure 10 of the paper (shown below). Similar to earnings announcement returns for other anomalies, there is a large reaction to the constrained firms around earnings announcement dates.
The results are hypothetical results and are NOT an indicator of future results and do NOT represent returns that any investor actually attained. Indexes are unmanaged, do not reflect management or trading fees, and one cannot invest directly in an index. Additional information regarding the construction of these results is available upon request.
Natural question: Do CFOs and CEOs take advantage of their overpriced stock?
Yes!
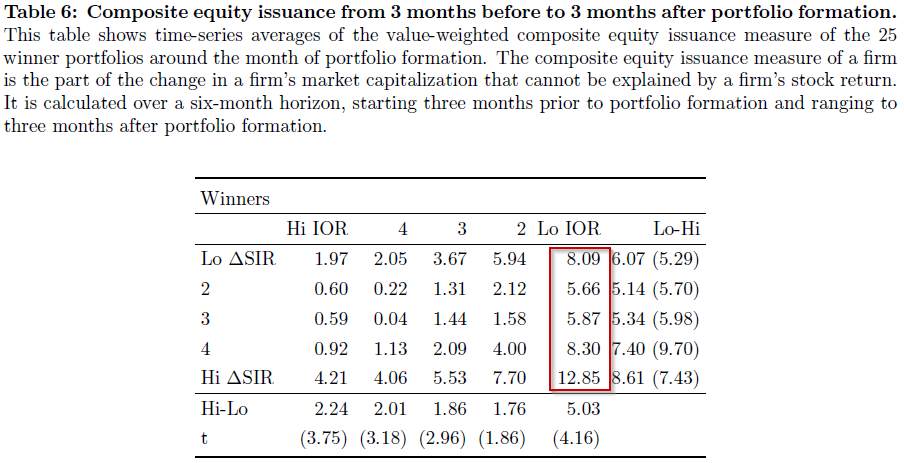
The authors use the composite equity issuance variable from Daniel and Titman (2006) to measure the amount of the firm’s market capitalization that cannot be accounted for through the firm’s stock return. In Table 6 (below), the authors find that 12.85% of the constrained winner’s market capitalization cannot be explained by the stock return! Thus, these constrained winners are issuing overpriced stock!
The results are hypothetical results and are NOT an indicator of future results and do NOT represent returns that any investor actually attained. Indexes are unmanaged, do not reflect management or trading fees, and one cannot invest directly in an index. Additional information regarding the construction of these results is available upon request.
Overall it appears that the CEOs and CFOs understand this overpricing, and issue stock. Figure 11 in the paper highlights that these firms issue the most around portfolio formation, which is generally when they are the most overpriced!
So Next Step — Let’s start shorting stocks!
As a weekly viewer of college Gameday on ESPN, I will quote Lee Corso — “Not so fast my friend!”(4)
But why?
Below I list 2 caveats to shorting these stocks.
As shown below in Figure 3, this portfolio of “constrained” winners has horrible returns. However, one should note that the surrounding portfolios all have positive returns. In addition, the T-stats comparing both (1) the High and Low institutional ownership quintiles and (2) the High and Low Short-Interest quintiles are not significant for any other group of winning stocks except for this one portfolio of “constrained winners”. Caveat 1 — there may be a robustness issue.
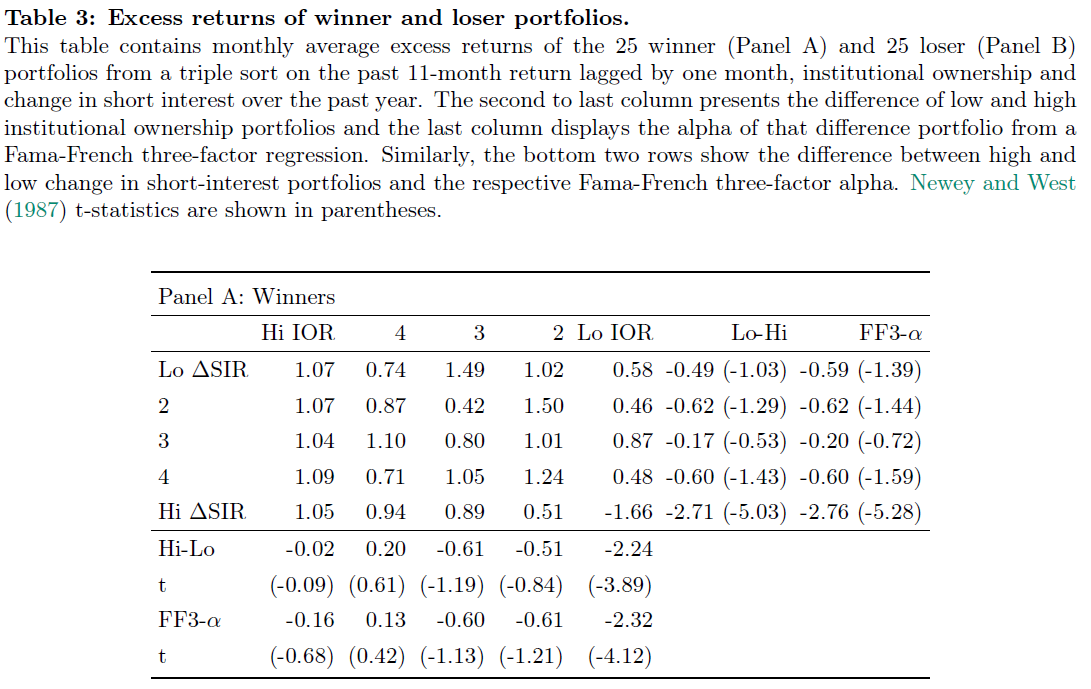
The results are hypothetical results and are NOT an indicator of future results and do NOT represent returns that any investor actually attained. Indexes are unmanaged, do not reflect management or trading fees, and one cannot invest directly in an index. Additional information regarding the construction of these results is available upon request.
Other issue arise when examining the simple portfolio characteristics: 1) How many firms are in the portfolio? 2) What is the average market cap. Table 4 in the paper highlights the summary statistics of the portfolios. One notices that on average there are only 16 firms in the portfolio, and by today’s standards these would be considered mid-cap firms (or small-caps for some investors), as the average market-cap for the portfolio is only $2.33 billion! Caveat 2 — the portfolio is extremely concentrated and may be difficult for large amounts of capital to short the stocks.
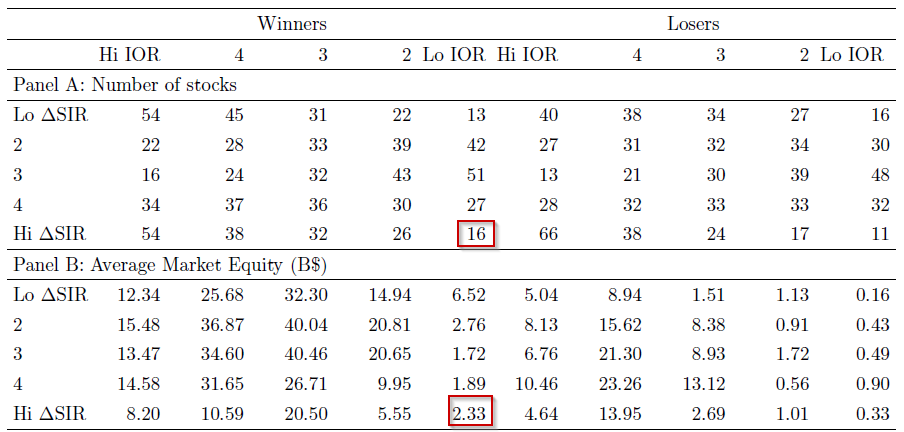
The results are hypothetical results and are NOT an indicator of future results and do NOT represent returns that any investor actually attained. Indexes are unmanaged, do not reflect management or trading fees, and one cannot invest directly in an index. Additional information regarding the construction of these results is available upon request.
Conclusion
Overall, the paper highlights a very interesting finding–for a subset of winning stocks that are constrained, the future returns are well below the standard momentum portfolio return. It appears, from both the model and the data, that the constraint on short selling allows for unwarranted optimism for this subset of stocks. This adds to the literature on momentum investing, as well as on financial bubbles–from the conclusion of the paper:
Our analysis also speaks to the ongoing discussion about the presence of bubbles in financial markets. Fama states “Bubbles are special cases of market inefficiency where cumulative returns differ predictably from equilibrium expected returns for sustained periods.” We show that irrational run-ups in prices of constrained stocks lead to forecastable negative long-term returns, a pattern that could be labeled an individual bubble. Our empirical evidence shows that individual bubbles are identifiable in all time periods of our sample and are not only present in one specific time period.
So it appears short-sale constraints push aside the pessimists and can lead to overpricing. From an investing standpoint, it may make sense to avoid going long those types of “constrained” winners, as opposed to shorting these stocks (see Caveats 1 and 2 above).
Let us know what you think!
Overpriced Winners
- Kent Daniel, Alexander Klos and Simon Rottke
- A version of the paper can be found here.
Abstract:
A strong increase in a firm’s market price over the past year is generally associated with higher future abnormal returns, consistent with the momentum anomaly. However, for a small set of firms for which arbitrage is limited, high past returns forecast strongly negative future abnormal returns. We propose a dynamic model in which increased unwarranted optimism by a set of speculators leads to dynamic mispricing effects. Consistent with this model, we show a set of firms with high past returns, low institutional ownership, and high recent changes in short interest earns persistently low returns going forward. A strategy that goes short the overpriced winners and long other winners generates a Sharpe-ratio of 1.08; its returns cannot be explained by commonly used risk-factors.
References[+]
| ↑1 | Note that the winner and loser portfolios have higher and lower performance (respectively) than the market over the 12 to 24 months after portfolio formation. Past that time period, the high momentum stocks actually underperform the loser portfolio–this highlights the need for one to rebalance a portfolio of high momentum stocks frequently (we have settled on quarterly) |
|---|---|
| ↑2 | Note there are other behavioral explanations and risk-based explanations as well. |
| ↑3 | See the paper for full details. |
| ↑4 | I have noticed my weekly College Gameday viewership amount is inversely related to the number of children I have |
About the Author: Jack Vogel, PhD
—
Important Disclosures
For informational and educational purposes only and should not be construed as specific investment, accounting, legal, or tax advice. Certain information is deemed to be reliable, but its accuracy and completeness cannot be guaranteed. Third party information may become outdated or otherwise superseded without notice. Neither the Securities and Exchange Commission (SEC) nor any other federal or state agency has approved, determined the accuracy, or confirmed the adequacy of this article.
The views and opinions expressed herein are those of the author and do not necessarily reflect the views of Alpha Architect, its affiliates or its employees. Our full disclosures are available here. Definitions of common statistics used in our analysis are available here (towards the bottom).
Join thousands of other readers and subscribe to our blog.