Wes recently challenged me with a unique proposition:
Hey Ryan, read through this Replicating Anomalies paper and tell me what you think. Its a bit long, but I’m curious to hear your thoughts.
Well, by “a bit long,” Wes really meant 144 pages of equations and reams of quantitative data on various factor analysis. Regardless, I jumped on the challenge grenade and decided to share a few thoughts with those of us in the investment community who don’t have a PhD in finance from the University of Chicago.
Big Picture Lesson: Don’t Believe Everything You Read
After powering through 144 pages of academic finance, dying a little bit at each point along the way, I came to a few conclusions — some new and some old:
- Old: Don’t believe anything you read on the internet
- Old: Don’t believe anything you read from an asset manager
- New: Don’t believe anything you read from an academic journal
I guess the logical conclusion is to not believe anything you read…but keep reading anyway…
A perfect example of the “not believing everything you read” rule of thumb is the so-called “tulip bubble.” Everything you read suggests it is the epitome of a bubble and that there are multiple lessons to be learned from this classic episode in time.
But there’s a problem: the tulip mania story may be bunk!
A new article in the Smithsonian has debunked that story. The story itself might be the actual bubble, not the actual events. The story has reached epic proportions (there’s even a movie in the works depicting it), but this article may cause the bubble to pop. I’m as guilty as anyone in perpetuating that myth. It sounded good to me, and I’ve used it in past conversations to make a point. But here we are, with the facts suggesting that I’ve been fooled the entire time.
Financial research papers, like notes from history, are never foolproof. Everyone writing history is bound to have some bias (history is written by the winners after all), and research papers are no different. Fund managers take financial research papers and attempt to apply them to ETF factor investing, so it’s important to get it as right as we can. The new “Replicating Anomalies” paper by Kewei Hou, Chen Xue, and Lu Zhang attempts to correct the history of anomalies that lead to out-performance in the stock market. It’s not specific to ETF factor investing, but it can be applied to help guide investors who invest in factor-based strategies.
How I read this Factor Investing Paper
Reading this study can be difficult — not going to lie.
Figuring out how to apply the information and make it practical is even harder. I’ll go through my five initial takeaways from the paper as a non-PHD, and attempt to apply them to ETF portfolio decisions.
Welcome to the Factor Zoo and ETF Factor Investing. It’s certainly wild.

How did I read this paper? I started at Table 1, on pages 53-61, which gives you what each symbol in the tables represent. The table breaks all of the different factors into six broad types:
- Momentum
- Value versus Growth
- Investment
- Profitability
- Intangibles
- Trading Frictions
Then, if you’re unsure of how that factor works based on the brief description in Table 1, you can scroll down to the Appendix, on pages 78 through 144, for a more in-depth explanation of the factor definitions and their portfolio construction.
You, the practitioner, can then look up your favorite type of factor for portfolio construction in table 1, dig in on pages 78-144 to confirm it’s the one you like, then you can scroll to the other tables to see how the study found it to perform in a market cap weighted portfolio, equal-weighted portfolio, and when HXZ attempted to replicate the finding of previous studies using their same sample data.
Table 3 would be where you don’t want to see your favorite factors, because factors listed here could not be replicated by the authors. If you don’t see it there, scroll to table 4. Table 4 is where the authors posted the factors that they found to have significance in their full sample, while market-cap weighting the portfolio.
Table 5 then attempts to confirm the robustness of the results further by proving significance or insignificance in the original samples. The original samples are the samples of the authors who first claimed to find the individual factor is significant, and HXZ attempts to replicate them using that data. So if your factor appears in both table 4, and table 5 as significant, that is encouraging.
Table 6 then takes the full sample (same as tables 3 and four), but instead of market-cap weighting the portfolios, they equal weight them.
Five Takeaways from the Paper for a Non-PhD
1.) Rebalance Frequency and Lookback Time Periods Matter
Let’s use the various ways you can weight a portfolio using book to market, as an example. There are five different ways to rebalance in the study:
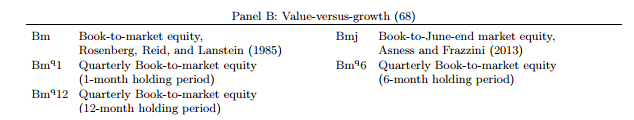
Of these five ways, three of them are significant in the full sample study and two are not. Bm, Bmj, and Bmq12 are significant. All three of these are essentially holding the cheapest decile of stocks by book-to market for 12 months. For a book to market portfolio, therefore, longer rebalance seem to be superior to shorter rebalance periods. Quarterly Book-to-market equity (1 month holding period), was insignificant in the original sample. Why a “staler” book-to-market works better than a “fresher” version is beyond me (and probably something we’d want to investigate to ensure B/M was robust!). Regardless, if one believes the results in this paper, a lower-frequency rebalanced b/m fund would be preferably to one that rebalances with a higher frequency.
2.) Value Investors Should Avoid Dividend-Yield Centric Portfolios
None of the dividend factors proved significant in the full sample market-cap weighted results. The results are all on table 3, and not in table 4. None were able to be replicated in the original samples (table 5). And none were significant when equal weighted. Yikes.
This one jumps out because of the rise of dividend investing in ETFs over the past ten years. Us investors love receiving dividends, but if you using high dividend yield as a proxy for your value exposure (and/or income stream), you may want to consider that decision.
3.) The Portfolio Weighting Scheme Matters — A Lot
When market-cap weighting the portfolios, the authors identify 161/447 factors that prove to be significant. Equal weighting delivers 244/447. This reinforces the fact that equal-weight portfolios are optimal from a performance perspective, however, this construction methodology also limits the scalability of a portfolio. The consensus from the research seems to be that anomalies exist net of transaction costs, but the scalability is limited.
When building your own portfolio, that is a tradeoff you can look at. The more scale a strategy has the less likely it is to outperform.
4.) For Return on Assets, the Shorter the Holding Period, the More Significant
Return on assets (a popular quality screen for ETFs) is shown to not have significance in the full sample when used as part of a 6 month holding period (Roa6) or 12 month holding period (Roa12), but it is effective when used with a 1 one month holding period (Roa1).
The same is true when constructing a portfolio based off of the change in ROA. It appears to work with a 1 month holding period (dRoa1) and 6 month holding period (dRoa6), but not for a 12 month holding period (dRoa12).
This also ties in with my first point: it matters when you rebalance for each factor. With book to market, it appears to perform better with less rebalancing, and ROA appears to be better with more frequent rebalancing. You can use this note to evaluate competing ETF strategies that use the same factors.
5.) High Turnover Momentum and R&D Intensive Firms Have Strong Performance
Price Momentum, using 11 month prior returns and a 1 month holding period (R111), and Quarterly R&D-to-market, using one month holding period (Rdmq1) have the highest average returns in the full sample. They are tied at an average return, m, of 1.19.
If you’re looking for ETFs with high returns, you can search for ETFs that use these strategies.
You could spend weeks — or more — looking at this piece and continue to pull new interesting insights to help guide your practice and build portfolios around ETF factor investing. I’ve only highlighted a few examples to help investors understand how to interpret the data. Just like how sabermetrics isn’t the only answer in how to build a baseball team, papers such as this aren’t the only thing to use to construct an ETF factor portfolio. Taking this paper though, and adding the lessons learned here along with your experience, can assist in making educated decisions to best help your business and your clients. My mind was changed on the tulip mania after finding new data, maybe this paper will do the same for some of your investing beliefs.
About the Author: Ryan Kirlin
—
Important Disclosures
For informational and educational purposes only and should not be construed as specific investment, accounting, legal, or tax advice. Certain information is deemed to be reliable, but its accuracy and completeness cannot be guaranteed. Third party information may become outdated or otherwise superseded without notice. Neither the Securities and Exchange Commission (SEC) nor any other federal or state agency has approved, determined the accuracy, or confirmed the adequacy of this article.
The views and opinions expressed herein are those of the author and do not necessarily reflect the views of Alpha Architect, its affiliates or its employees. Our full disclosures are available here. Definitions of common statistics used in our analysis are available here (towards the bottom).
Join thousands of other readers and subscribe to our blog.