Academic research is amazing and incredibly useful for helping us better understand the complex world in which we live. In fact, academic research has literally rewired my brain at times. However, research isn’t perfect and the search for truth is messy. Data-mining. Overfitting. P-hacking. We’ve recently covered the subject here, here, and here.
What’s the bottom line? Disregard everything you read? Is it all “fake news?” That probably isn’t the answer.
The real bottom line is that we should be skeptical of research — even peer-reviewed academic research — because there are hidden biases involved and bad science is everywhere. This is not to say that academic researchers are nefarious or evil. In fact, I’d argue that academic researchers have the purest (albeit, far from perfect) incentives to find the intellectual truth among all research groups (e.g., practitioners like us who are always selling something!).
Another point to make clear upfront is that attacks on prior research results are genuinely not personal attacks and these critiques say little about the personal integrity of the authors. When research critiques are viewed as personal attacks (which often happens), the ability to think rationally about what the critique is unveiling is often blocked and the real message is lost. The reality is that research critiques should be viewed as attempts to get better and help everyone get closer to understanding “the truth.” Whatever that might be. Academics are aware of the problem and actively trying to solve it. For example, Ivo Welch created the Critical Finance Review and Cam Harvey highlighted the challenges of research in front of the entire profession!
Okay, with all those disclaimers up front, I’d like to introduce a cool paper that may raise more questions than providing answers. Kewei Hou, Chen Xue, and Lu Zhang (“HXZ”) attack the “robustness” question in academic finance research by pulling off an epic replication effort in their new paper, “Replicating Anomalies.” The Replicating Anomalies paper is a great example of a paper that can easily be perceived as sh$%ing on the entire research profession, but I think a better takeaway is we should find ways to enhance the integrity of research results in the future.(1)
Most Anomalies Fail to Replicate?
HXZ review 447 variables in the literature (minimizing the focus on microcaps) and replicate the results under their research conditions. 286 of the anomalies (64%) end up being less robust than previously thought — in other words, no statistical significance. For the 161 anomalies that do appear robust, their magnitudes are often much less than originally reported, and by using fancier asset pricing factor models (which have their own problems), 115/161 don’t have significant “alphas.” Long story short, there doesn’t seem to be many “anomaly” strategies that can’t be explained by known factors. As some market commentators say, “alpha is really a beta waiting to be discovered.” Does that mean we should all buy S&P 500 Vanguard funds? No, it just means that whatever you are buying probably has some risk/reward trade-off that should be considered. However, “free/easy” money probably doesn’t exist.(2)
Here is a summary chart of the results with my sophisticated classification system highlighted on the right of the chart:

What is happening? Turns out that many of the replication failures revolve around the simple fact that microcaps are essentially eliminated from the replication studies. Whereas microcaps make up 60% of the NYSE/AMEX/NASDAQ CRSP universe, they represent only 3% of the total market. The authors also focus on market-cap weighted, or “value-weighted,” portfolio constructs, which emphasize bigger stocks. So this paper is really a replication study that says, “The anomalies don’t seem very robust among fairly scalable portfolio constructs.” The paper also shows that Fama is simultaneously probably right, but also wrong, with the key variable being, “What universe are you looking at?” Chalk one up for the Nobel prize winner (don’t worry, there are a lot of “losses” for Fama in this paper as well).
Which Anomalies Survive?
We try and explore the data to death from various angles to find the most robust way to capture risk premium that we think provides favorable risk/reward characteristics for long-horizon capital. In particular, we like good-old-fashioned “academic” momentum, i.e. 2-12 momentum, as a baseline (you can learn more about that here). When it comes to value, we like EBIT/TEV (learn more here).
Let’s first look at the momentum replication results from the paper. See the table below:
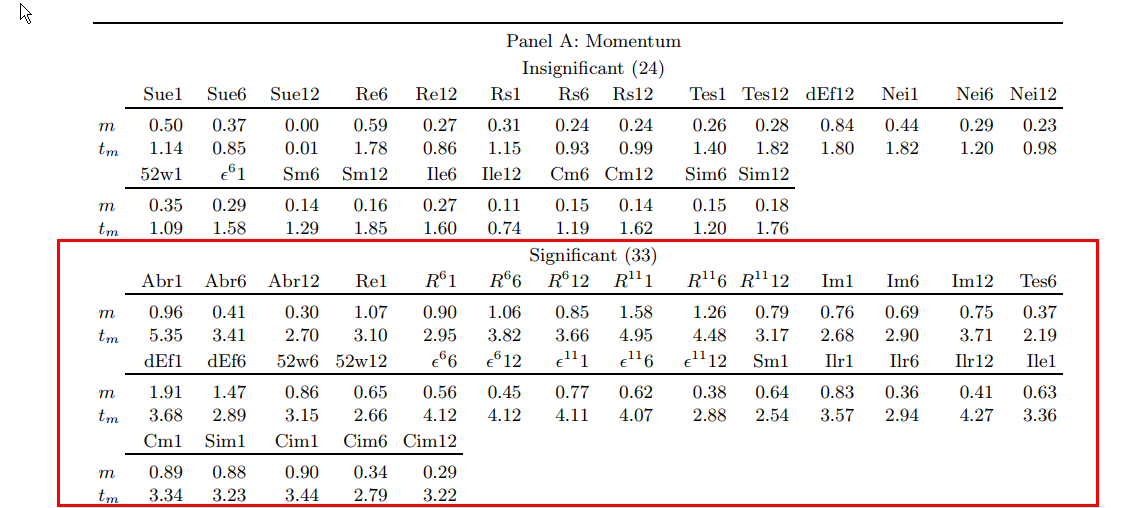
Among the various ways to do “momentum,” the classic version of basically sorting stocks on their past 12 month returns (skipping the recent month, hold for a month, R111) seems to be robust. Industry momentum is legit. Residual momentum is legit. Abnormal earning announcement returns are legit. Customer momentum is legit. All the other setups are hard pressed to perform under the author’s conditions (to include the 52-week high approach, which we discuss in our Quantitative Momentum book as being bogus).
Let’s check out value now.
Here are the replication results:
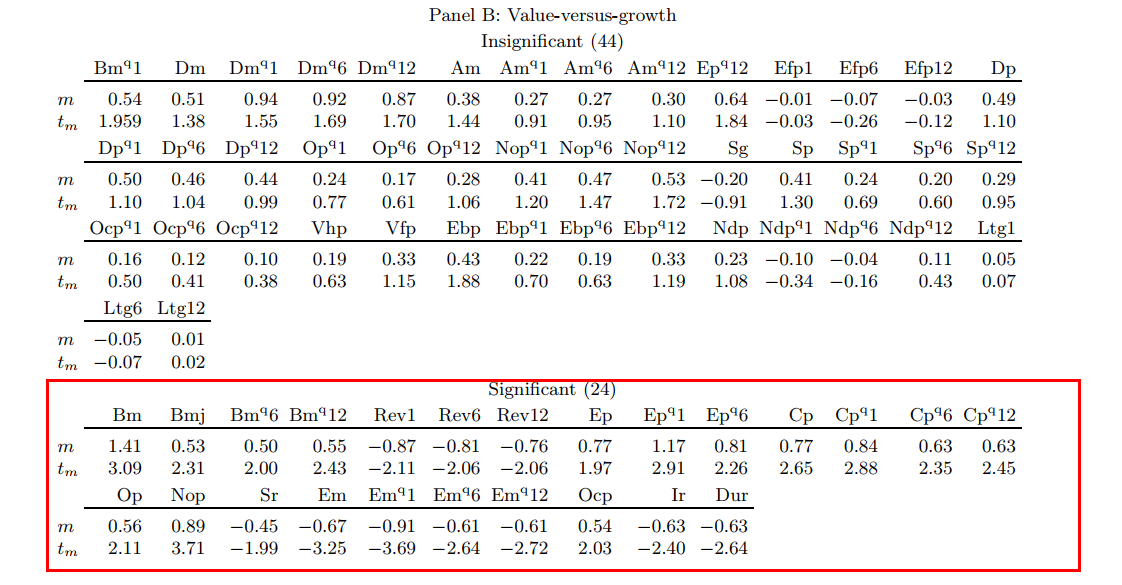
The results are hypothetical results and are NOT an indicator of future results and do NOT represent returns that any investor actually attained. Indexes are unmanaged, do not reflect management or trading fees, and one cannot invest directly in an index.
All the classics pass muster: book-to-market, earnings-to-price, cash-flow-to-price, and…our favorite…enterprise multiples (which is solid across the board, whereas the other metrics are hit or miss)!
Other value metrics simply can’t handle the heat and should arguably be kicked out of the kitchen: dividend yield, payout yields, forecasted yields, sales-to-price, etc.
How to Read the Paper
This paper is chalk full of interesting empirical insights (we only covered a few of them above). Here is the recommended approach to tackling the paper:
- Open the paper on 2 monitors
- On monitor #1 open up Tables 3 and 4.

The results are hypothetical results and are NOT an indicator of future results and do NOT represent returns that any investor actually attained. Indexes are unmanaged, do not reflect management or trading fees, and one cannot invest directly in an index.
Now review the various data in Tables 3 and 4. Each strategy is marked with a symbol. For example, Dp and Op are in Table 3 above. But what are “Dp” and “Op”? That’s where the appendix comes in handy on monitor #2. Look up Dp and Op in the variable definitions — sections A.2.14 and A.2.16, respectively. Dp = Dividend yield and Op = Payout Yield.
Summary
Read this paper if you claim to be an evidence-based investor. We’ve only hit the wavetops on the results and there are many more goodies inside (Lu Zhang mentioned that the paper took 3 years to create!). Many of the products and investments you currently hold may be reliant on funky studies. These strategies often use metrics that can’t be replicated. We also really like the summary of the paper. Here is a snippet:
Finally, we emphasize that theories should be developed on the economic foundation of first principles, before doing the empirical work, to guard against HARKing (hypothesizing after the results are known) (Kerr 1998).
In other words, understand how and why the person on the other side of the trading table is giving you extra return. If you don’t know what risk you are buying and/or the edge you have, you shouldn’t be playing at the table.
Replicating Anomalies
- Hou, Xue, and Zhang
- A version of the paper can be found here. Slides here.
- Want a summary of academic papers with alpha? Check out our Academic Research Recap Category.
Abstract:
The anomalies literature is infested with widespread p-hacking. We replicate this literature by compiling a large data library with 447 anomalies. With microcaps alleviated via NYSE breakpoints and value-weighted returns, 286 anomalies (64%) including 95 out of 102 liquidity variables (93%) are insignificant at the 5% level. Imposing the t-cutoff of three raises the number of insignificance to 380 (85%). Even for the 161 significant anomalies, their magnitudes are often much lower than originally reported. Among the 161, the q-factor model leaves 115 alphas insignificant (150 with t < 3). In all, capital markets are more efficient than previously recognized.
References[+]
| ↑1 | Note: We’ll have Lu Zhang on the Behind the Markets podcast on 10/14/2017 where we will be asking him a lot of questions and getting additional insights on the research. |
|---|---|
| ↑2 | To that point, I’d say, “No sh$%.” See our sustainable active framework piece. |
About the Author: Wesley Gray, PhD
—
Important Disclosures
For informational and educational purposes only and should not be construed as specific investment, accounting, legal, or tax advice. Certain information is deemed to be reliable, but its accuracy and completeness cannot be guaranteed. Third party information may become outdated or otherwise superseded without notice. Neither the Securities and Exchange Commission (SEC) nor any other federal or state agency has approved, determined the accuracy, or confirmed the adequacy of this article.
The views and opinions expressed herein are those of the author and do not necessarily reflect the views of Alpha Architect, its affiliates or its employees. Our full disclosures are available here. Definitions of common statistics used in our analysis are available here (towards the bottom).
Join thousands of other readers and subscribe to our blog.