The Conservative Formula: Quantitative Investing made Easy
- Pim van Vliet and David Blitz
- A version of this paper can be found here.
- Want to read our summaries of academic finance papers? Check out our Academic Research Insight category.
What are the research questions
Is it possible to build a simple systematic approach that beats investing in complex factor models? The research team here has proposed that a simple formula based on low return volatility, high net payout yield (dividends +/- stock buybacks), and strong price momentum gives investors exposure to the most important factor premiums in one easy-to-implement investment strategy.
- Does the conservative investment formula beat more complicated factor models?
- The return spread between the conservative portfolio and the speculative portfolio was 13% per year. How much of this return spread can be attributed to exposure to the classic Fama-French long-short factors or exposure to new factors?
What are the Academic Insights?
The research team developed their model of investment criteria based on 3 factors:
Low risk, cheap, and strong. Pretty simple.
For the US data, the authors utilize CRSP data going back to 1926. In an effort to reinforce the integrity of their model they build a portfolio of 100 companies utilizing only the largest 1000 stocks in the market at each point in time. In addition to the US, the team added in 3 other broad regions — Europe, Japan, and emerging markets — to add robustness to the model. They continued to build their portfolio with the 1000 largest stocks in each region, with a final portfolio consisting of 100 stocks.
The process to narrow down the 1000 stocks to 100 went as follows:
- First, they sorted the 1000 stocks into two groups based on their historical 36-month stock return volatility, which yields a high volatility group and a low volatility group.
- Then each stock in the low volatility group is ranked on its 12-1 month price momentum and total net payout yield.
- The momentum and net payout ranks (1-500) are simply averaged and the 100 best stocks in the final portfolio are equally weighted.
Answers to the research questions:
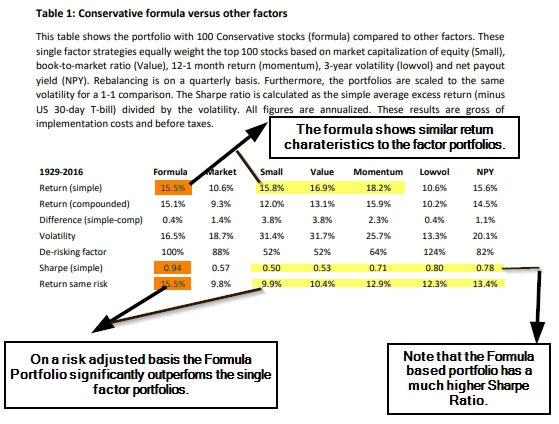
- The conservative formula had similar return characteristics to several other single factors on a simple return basis. However, when risk was taken into account and the conservative formula had much lower volatility and a higher Sharpe ratio than it’s competitors. Once you “de-risk” the factor portfolios by weighting a % of the allocation into the risk-free asset, the conservative formula handily beats on return. Even besting each of the individual characteristics the compose the conservative formula. See Table 1 below for the full summary of results.
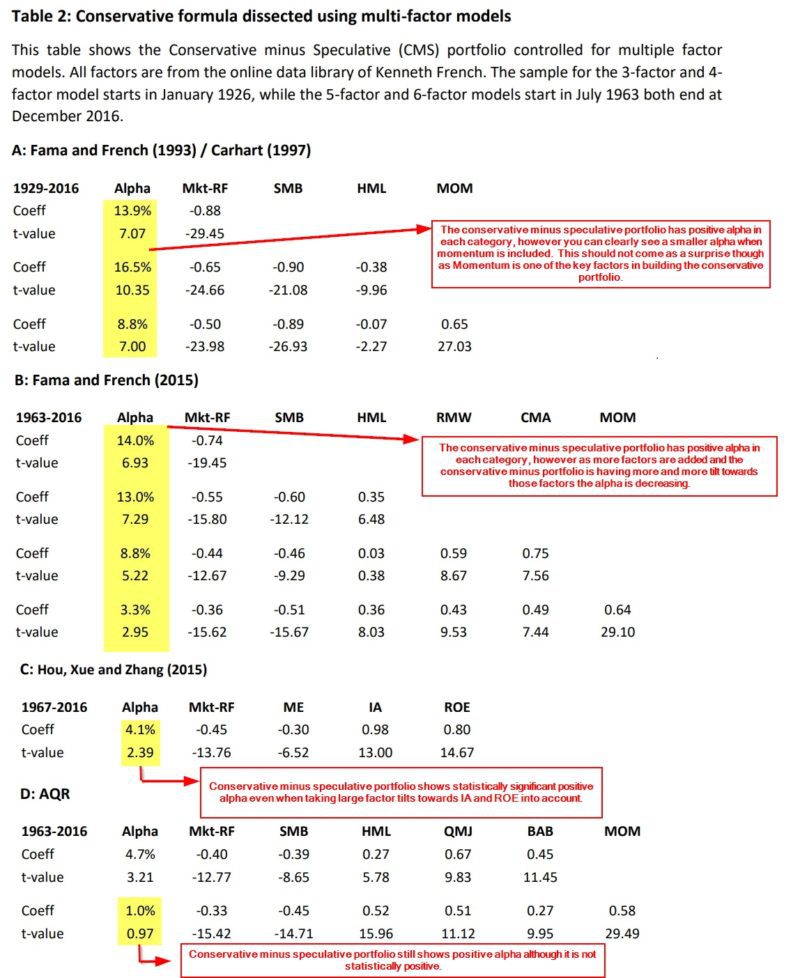
- The conservative minus speculative strategy shows positive tilting towards value, momentum, profitability, and investment factors at the same time. However, even after controlling for all these factors, a small, but significant, positive alpha remained. When comparing the conservative minus speculative portfolio against the q-factor model of Hou, Xue, & Zhang they found that the conservative less speculative portfolio had large positive loadings to investment and profitability factors. After controlling for these exposures the alpha of the conservative minus speculative formula was still 4.1% per annum. The only factor combinations in which the conservative minus speculative formula did not exhibit statistically positive alpha was in a combination of the classic value and momentum factors of Fama-French, and the two new AQR factors.
These results remained robust when looking internationally as well as across US mid and small cap stocks.
Why does it matter?
The research team set out to create a formula which is designed to make factor investing easy for investors. In general, they succeeded in creating a fairly simple model utilizing easy to obtain data, that is in a segment of the market that is liquid and easily investable. While achieving the goals of simplicity and liquidity the conservative formula does give positive factor tilts towards low-beta, value, quality, and momentum.
What are the most important charts from the paper?
The results are hypothetical results and are NOT an indicator of future results and do NOT represent returns that any investor actually attained. Indexes are unmanaged, do not reflect management or trading fees, and one cannot invest directly in an index. Additional information regarding the construction of these results is available upon request.
Bonus chart is here:
The results are hypothetical results and are NOT an indicator of future results and do NOT represent returns that any investor actually attained. Indexes are unmanaged, do not reflect management or trading fees, and one cannot invest directly in an index. Additional information regarding the construction of these results is available upon request.
Abstract
We propose a conservative investment formula which selects 100 stocks based on three criteria: low return volatility, high net payout yield, and strong price momentum. We show that this simple formula gives investors full and efficient exposure to the most important factor premiums, and thus effectively summarizes half a century of empirical asset pricing research into one easy to implement investment strategy. With a compounded annual return of 15.1 percent since 1929, the conservative formula outperforms the market by a wide margin. It reduces downside risk and shows a positive return over every decade. The formula is also strong in European, Japanese and Emerging stock markets, and beats a wide range of other strategies based on size, value, quality, and momentum combinations. The formula is designed to be a practically useful tool for a broad range of investors and addresses academic concerns about ‘p-hacking’ by using three simple criteria, which do not even require accounting data.
References[+]
| ↑1 | Our low volatility archives to learn more. |
|---|---|
| ↑2 | Our value archives to learn more. |
| ↑3 | Our momentum archives to learn more. |
About the Author: Rich Shaner, CFA
—
Important Disclosures
For informational and educational purposes only and should not be construed as specific investment, accounting, legal, or tax advice. Certain information is deemed to be reliable, but its accuracy and completeness cannot be guaranteed. Third party information may become outdated or otherwise superseded without notice. Neither the Securities and Exchange Commission (SEC) nor any other federal or state agency has approved, determined the accuracy, or confirmed the adequacy of this article.
The views and opinions expressed herein are those of the author and do not necessarily reflect the views of Alpha Architect, its affiliates or its employees. Our full disclosures are available here. Definitions of common statistics used in our analysis are available here (towards the bottom).
Join thousands of other readers and subscribe to our blog.