A question I’ve received in the past is the following:
If you could go back in time five years ago and tell yourself something about investing, what would it be?
My response is the following:
Tracking error.
First, what is tracking error?(1)
Tracking error is a measure of how much a strategy deviates from a benchmark. If you are a U.S. equity investor, a standard benchmark is the SP500.(2) One can mathematically compute tracking error, which I will do below and is found here, but here is a simple example–my portfolio is up 15% and the benchmark (SP500) is up 25%. Thus, I have lost by 10% to the index (or my simple “tracking error” is 10%).
Second, why would I have gone back in time and told my younger self about such a simple concept? Also, why didn’t I know about this 5 years ago?
Well, the answer is that I definitely knew about the concept (we had the calculations in our analysis files), but seeing it while running real-world portfolios is completely different than calculating it on paper portfolios!
Probably the main reason that I would have gone back and told myself about tracking error has to do with a portfolio strategy we like: trend following.
As many of our readers know, we are fans of trend-followed portfolios. For those unfamiliar with trend following, the idea is rather simple–invest in an asset class if the price/return to that asset class is trending up. If not, go to cash or hedge your exposure.(3)
The concept is simple, and for many investors who are unwilling to accept large losses in their portfolio, the idea sounds great.
To be clear, this portfolio will behave differently than B&H, which is the standard index.
And what happens when you are different than the index? You create tracking error!
In this post, I wanted to highlight how large and extremely painful tracking error can be — especially if you are benchmarked against a buy-and-hold (“B&H”) portfolio.
First, let’s examine simple trend-following performance.
Historical Trend-Following Performance
To give some broader context to trend-following, I am displaying the returns to trend-followed portfolios on the five major asset classes:
- SP500 — SP500 total return
- EAFE — EAFE total return
- T-Bond — U.S. 10-Year Treasury Bond total return
- REITs — NARIET index total return
- Commodities — GCSI index total return
The portfolios and their returns are shown first without trend, and then with trend-following.
The returns below are from 1/1/1973-12/31/2017. All portfolios are gross of any transaction or management fees.
| SP500 | EAFE | T-Bond | REITs | Commodities | |
| CAGR | 10.52% | 8.49% | 7.75% | 11.94% | 5.84% |
| Standard Deviation | 15.14% | 17.03% | 8.15% | 16.88% | 20.34% |
| Maximum Drawdown | -50.21% | -56.68% | -20.97% | -68.30% | -80.90% |
The results are hypothetical results and are NOT an indicator of future results and do NOT represent returns that any investor actually attained. Indexes are unmanaged, do not reflect management or trading fees, and one cannot invest directly in an index.
The returns below are from 1/1/1973-12/31/2017. All asset classes apply a 12-month moving average rule to the total return index, and either invest (1) in the index if a positive trend or (2) in cash (U.S. T-bills) is a negative trend. All portfolios are gross of any transaction or management fees.
| SP500 (trend) | EAFE (trend) | T-Bond (trend) | REITs (trend) | Commodities (trend) | |
| CAGR | 10.87% | 9.85% | 7.67% | 11.57% | 8.12% |
| Standard Deviation | 11.58% | 12.10% | 6.88% | 12.03% | 16.26% |
| Maximum Drawdown | -23.58% | -21.08% | -11.26% | -20.77% | -57.41% |
The results are hypothetical results and are NOT an indicator of future results and do NOT represent returns that any investor actually attained. Indexes are unmanaged, do not reflect management or trading fees, and one cannot invest directly in an index.
As is shown above, the overall annualized returns to trend-followed portfolios, over long-time cycles, are definitely not that much different than B&H.
But what is the tracking error caused by trend following?
Trend-Following Tracking Error Statistics
So now that we have the baseline stats on B&H and trend-following, what is the tracking error of the trend-followed portfolios relative to the B&H portfolios?
The numbers are shown below the respective tracking errors for each of the asset class relative to its trend-followed component over the 1/1/1973-12/31/2017 time period.
| SP500 | EAFE | T-Bond | REITs | Commodities | |
| Tracking Error (relative to respective B&H returns) |
9.79% | 11.97% | 4.44% | 11.93% | 12.17% |
The results are hypothetical results and are NOT an indicator of future results and do NOT represent returns that any investor actually attained. Indexes are unmanaged, do not reflect management or trading fees, and one cannot invest directly in an index.
So the numbers above give the annualized tracking error, which can be thought of as the standard deviation of the return differences between the trend-followed portfolio and the B&H portfolio. What we notice is that the tracking error is around 10% for the more volatile asset classes, whereas, for bonds (which are less volatile), the tracking error is around 5%.
But once again, as I highlighted above, it is easy to say, “Yeah, the tracking error is 10%… I will accept this, no problem. After all, the returns to trend following are almost the same as B&H”.
But is there another way to describe the pain, or at least make it understandable for potential investors?
Below I make an attempt, by examining the rolling CAGR of the trend-followed SP500 relative to the SP500 Index, which is B&H. What this does is compute the CAGR (over the last year) every month for both (1) the SP500 and (2) the SP500 with trend-following portfolios, and then plots the difference between the two every month.
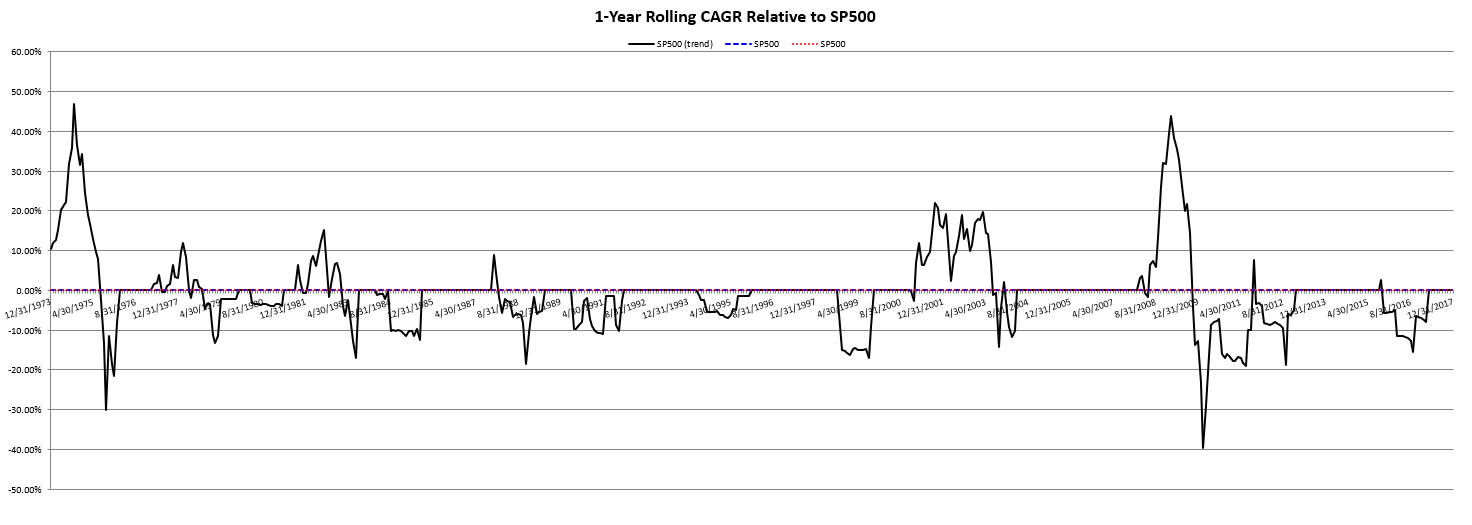
The results are hypothetical results and are NOT an indicator of future results and do NOT represent returns that any investor actually attained. Indexes are unmanaged, do not reflect management or trading fees, and one cannot invest directly in an index.
As one notices above, there are some years with significant deviations of 30%+ relative to the B&H benchmark! To highlight exactly what the chart above plots, I will pick a few observations:
- 2/28/2009: We see a large spike above 40%. This is due to the SP500 B&H having a 1-year CAGR of -42.5% and the SP500 with trend-following having a 1-year CAGR of +1.35%, for a difference of around +44%.
- 2/28/2010: We see a large spike above 40%. This is due to the SP500 B&H having a 1-year CAGR of +52.8% and the SP500 with trend-following having a 1-year CAGR of +13.1%, for a difference of around -40%.
- 2/28/2014: We see no difference (0%). This is due to no trend-rules being broken over this period, so both the SP500 and the Sp500 with trend-following having a 1-year CAGR of +22.9%.
Hopefully, the examples above highlight what the chart is graphing.
To further emphasize the differences that can occur, here is a chart of the rolling 5-year CAGRs–so same as above except I changed the look-back period to 5 years as opposed to 1 year.
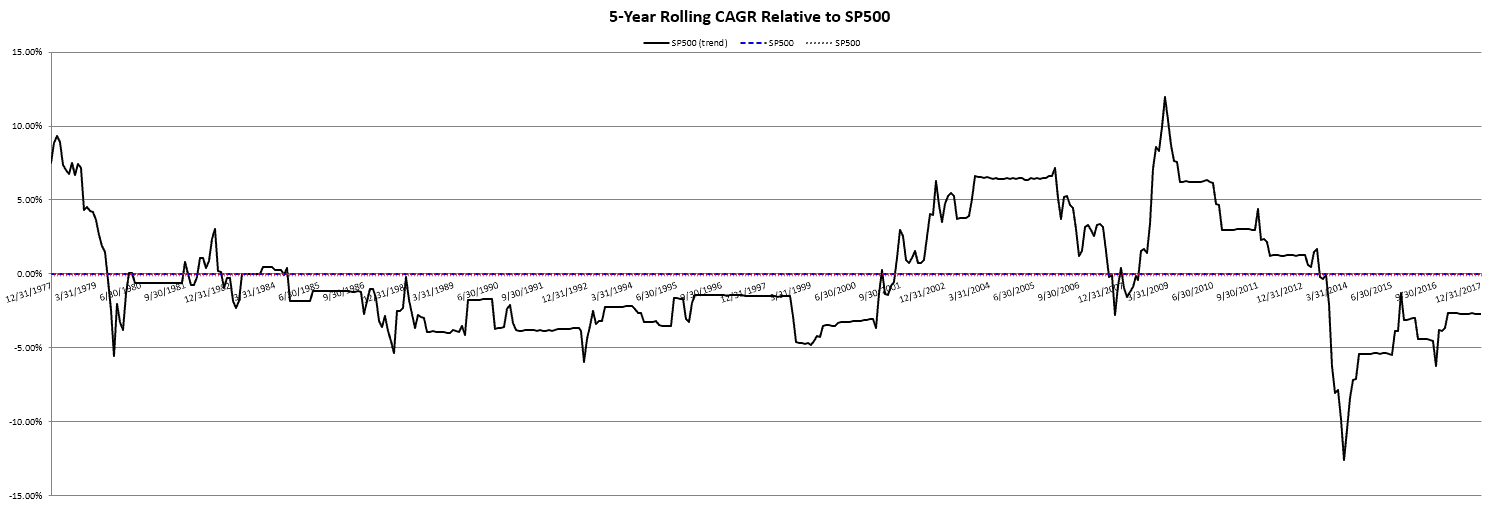
The results are hypothetical results and are NOT an indicator of future results and do NOT represent returns that any investor actually attained. Indexes are unmanaged, do not reflect management or trading fees, and one cannot invest directly in an index.
Here we see less wild swings, as the 5-year CAGRs are generally similar. However, we do see long-periods of underperformance from this chart!(4) Take, for example, the period between 1980 – 1999, a 25-year stretch (accounting for 1975-1980, as we are looking at 5-year CAGRs). One notices that the rolling 5-year CAGR of the trend-followed portfolio relative to the SP500 is below 0% for the majority of the period. Let’s examine the returns during this period a little closer.
Below are the summary statistics from 1/1/1975 – 12/31/1999, a 26-year period!
| SP500 (trend) | SP500 | |
|---|---|---|
| CAGR | 14.46% | 17.32% |
| Standard Deviation | 13.31% | 14.91% |
| Maximum Drawdown | -23.58% | -29.58% |
The results are hypothetical results and are NOT an indicator of future results and do NOT represent returns that any investor actually attained. Indexes are unmanaged, do not reflect management or trading fees, and one cannot invest directly in an index.
So we are talking about a 26-year underperformance stretch!
To make the picture clearer, let’s examine the invested growth, non-log scale.
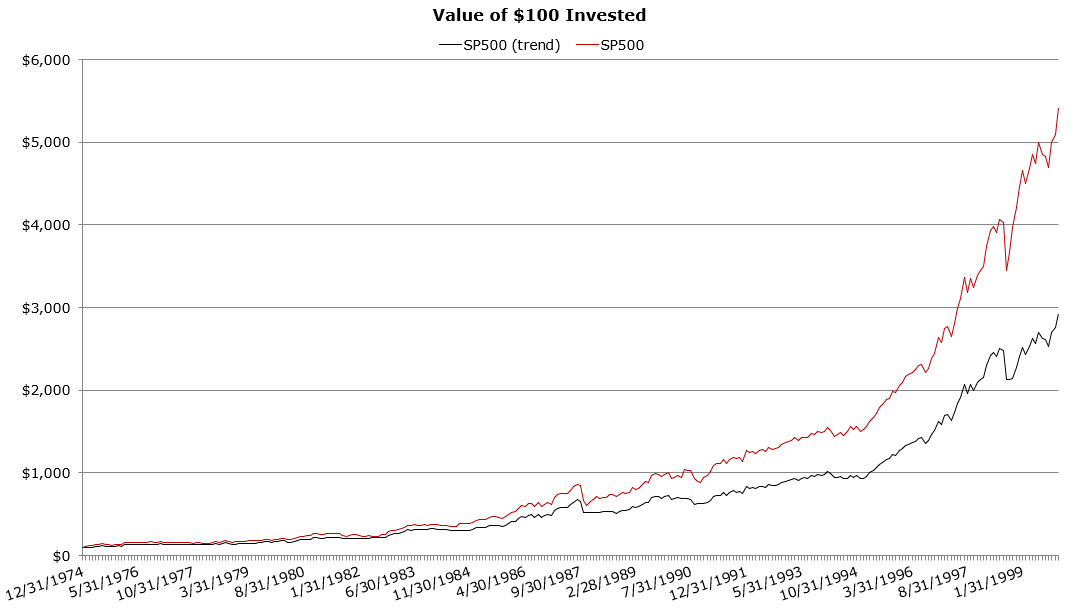
The results are hypothetical results and are NOT an indicator of future results and do NOT represent returns that any investor actually attained. Indexes are unmanaged, do not reflect management or trading fees, and one cannot invest directly in an index.
Over a 26-year period, the image above shows the compound growth difference! This is relative tracking error!
But should we expect this? Well, if one believes that (1) markets grind higher over long periods of time and (2) major market downfalls occur in shorter windows, then this is to be expected, as this was a time-period with no major (35%+ market corrections).
So the chart above fits reasonable expectations–trend-following in time periods without major asset class corrections, will underperform. Why? Well if one believes that investors are rewarded for taking on risk (a reasonable assumption!), a portfolio that takes on less risk by trend following (which it out of the market and sitting in cash a decent amount of the time) should have lower returns in a rational world.
It should be noted, here is the performance over the next 18 years:
Below are the summary statistics from 1/1/2000-12/31/17:
| SP500 (trend) | SP500 | |
|---|---|---|
| CAGR | 7.11% | 5.58% |
| Standard Deviation | 9.18% | 14.48% |
| Maximum Drawdown | -16.88% | -50.21% |
The results are hypothetical results and are NOT an indicator of future results and do NOT represent returns that any investor actually attained. Indexes are unmanaged, do not reflect management or trading fees, and one cannot invest directly in an index.
During the large equity drawdowns in 2000/2001 and 2008/2009, the trend-following portfolio made up some ground on the B&H portfolio.
But once again, let’s examine the “tracking error” by breaking the 1/1/2000-12/31/17 period into two parts:
- 1/1/2000-12/31/2009
- 1/1/2010-12/31/2017
So over this 17 year period when trend-following outperformed B&H, what are the returns in the sub-periods?
Below are the summary statistics from 1/1/2000-12/31/09:
| SP500 (trend) | SP500 | |
|---|---|---|
| CAGR | 5.64% | -0.68% |
| Standard Deviation | 8.66% | 16.06% |
| Maximum Drawdown | -14.37% | -50.21% |
The results are hypothetical results and are NOT an indicator of future results and do NOT represent returns that any investor actually attained. Indexes are unmanaged, do not reflect management or trading fees, and one cannot invest directly in an index.
Common Response: Trend Following is Awesome and I love tracking error!
Below are the summary statistics from 1/1/2010-12/31/17:
| SP500 (trend) | SP500 | |
|---|---|---|
| CAGR | 8.97% | 13.96% |
| Standard Deviation | 9.81% | 11.98% |
| Maximum Drawdown | -16.88% | -16.26% |
The results are hypothetical results and are NOT an indicator of future results and do NOT represent returns that any investor actually attained. Indexes are unmanaged, do not reflect management or trading fees, and one cannot invest directly in an index.
Common Response: Trend Following is Stupid and I hate Tracking Error!
The above results highlight that the tracking error number describe above is a double edge sword–it can be both positive and negative.
The results are the same for the other asset classes and yield similar conclusions.
Conclusions Regarding Trend Following and Tracking Error
The concept of tracking error appeared relatively useless to me five years ago. My thinking was the following: who cares how one does relative to an index, I should care more about the process and live with the consequences. After all, this is how most Vanguard/B&H investors think–simply invest in a market-cap weighted stock/bond portfolio, and live with the consequences. And I still believe in the process of trend-following, which we outline here.
However, I now have an appreciation for tracking error. The tracking error to a trend following strategy is large. When tracking error goes against you, this is an extremely painful process one can endure. Human emotions get involved–which is generally not good for investment decisions! As we have noted many times on our site, no strategy is perfect.
References[+]
| ↑1 | Note, I have given different perturbations of this answer, but this was the main answer |
|---|---|
| ↑2 | This is generally true even if one is investing a portion of the equity portfolio in international stocks. |
| ↑3 | We have articles here and here describing the pros and cons of trend-following. |
| ↑4 | As noted by the differences in CAGRs being negative. |
About the Author: Jack Vogel, PhD
—
Important Disclosures
For informational and educational purposes only and should not be construed as specific investment, accounting, legal, or tax advice. Certain information is deemed to be reliable, but its accuracy and completeness cannot be guaranteed. Third party information may become outdated or otherwise superseded without notice. Neither the Securities and Exchange Commission (SEC) nor any other federal or state agency has approved, determined the accuracy, or confirmed the adequacy of this article.
The views and opinions expressed herein are those of the author and do not necessarily reflect the views of Alpha Architect, its affiliates or its employees. Our full disclosures are available here. Definitions of common statistics used in our analysis are available here (towards the bottom).
Join thousands of other readers and subscribe to our blog.