In this article, we discuss why trusting an investment process can be very hard, and how you should approach the challenge.
Trust the Process – the 76ers fans’ rally cry
As a native Philadelphian and huge basketball fan, I fully agree with the 76ers fans’ rally cry — Trust the Process.
Even the players, such as Joel Embiid, have echoed the sentiment of the fans:
For those not in Philly and not too familiar with the NBA, “Trust the Process” explains the 76ers rebuilding process under former GM Sam Hinkie. If one simply goes to Google and types in “Trust the process”, you will see an image of Sam Hinkie on the front page, thanks to his Wikipedia page.(1)(2)
In Sam’s mind, as well as many who watch the NBA, to win a championship you need a superstar player. Coaches can help, but the superstar player is more important.
What is the evidence for this?
Well, consider this, since the 1983 season (last 76ers championship), here are eleven players who had multiple championships.(3)
Larry Bird (1984, 1986), Magic Johnson (1985, 1987, 1988), Isiah Thomas (1989, 1990), Michael Jordan (1991-1993, 1996-1998), Hakeem Olajuwon (1994, 1995), Tim Duncan (1999, 2003, 2005, 2007, 2014), Shaq (2000-2002, 2006), Kobe (2000-2002, 2009-2010), LeBron (2012, 2013, 2016), Steph Curry (2015, 2017, 2018), Kevin Durant (2017, 2018).
The only three missing championships:
- 2004 Pistons — a great defensive team with five good players: Rasheed Wallace, Chanucey Billups, Ben Wallace, Tayshaun Prince, and Richard Hamilton
- 2008 Celtics — the “big three” of Kevin Garnett, Paul Pierce, and Ray Allen
- 2011 Mavericks — Dirk Nowitzki, 6th on the all-time scoring list in NBA history, as well as Jason Kidd and an in-his-prime Tyson Chandler
As one can notice above, the eleven players listed above accounted for 32 of the past 35 championships (~91%).
So where does “trusting the process” come into play with regards to the 76ers plan to win a championship?
Examining this from the 76ers perspective, let’s go through the steps:
- Goal: win a championship
- Process and logic: (
intentionally) lose in order to increase the probability of getting a high draft pick. Why? Facts: (1) 91% of the past championships have gone to “superstar” players and (2) superstar players generally get selected high in the draft. Thus, by having more high draft picks, the process gives the 76ers a higher chance of getting a superstar. - Trust the process
Thus, the 76ers fans have clung to the slogan, “Trust the Process.” The “Process” set forward by Sam was rather simple — keep losing and increase the unconditional probability of getting a high draft pick, as the best players generally are drafted very high in the draft!
Simple enough.
Assuming Joel Embiid and Ben Simmons stay healthy, the 76ers appear to be on track (hopefully with help from LeBron) to being a serious NBA contender again.
A PDF version of this is available here.
How Does This Apply to an Investment Process?
Are there any parallels?
As outlined above, here is a rather simple outline used, which is applicable to most things in life as well:
- First, we need to outline the goal
- Second, we need to create an investment process backed by logic.
- Third, we need to ask the hard question, “Can I stick with the investment process?”
In my opinion, the third question, “Can I trust the investment process?”, yields wildly different behavioral effects/conclusions when comparing building an NBA team and assessing whether or not one can stick with an investment process.
Consider the following “trust the investment process” question in both contexts:
- Can I trust the Process set forward by Sam Hinkie to rebuild the 76ers?
Answer — Yes.
This is quite simple, you see with your eyes that one of your players, Joel Embidd, can dominate and win games.
2) Can I trust the Investment Process set forward by my research/advisor for my investments?
Here, the answer is murky.
It is not as clear-cut as watching an NBA player dominate other opponents.
Below I go through three examples of ways that one can invest, and highlight that while (1) figuring out the goal and (2) determining an investment process can appear to be relatively easy, (3) trusting the investment process can be very difficult.
Let’s dig into my three examples.
Example 1 — Invest in Stocks
So for anyone looking to invest, they need to first ask, what is the goal?
Let’s assume the goal is the following–achieve the highest returns possible. You understand and are willing to take additional (but not an unreasonable) risk, as measured by the standard deviation of returns.
Let’s also assume we (1) have a home country bias and (2) will exclude real estate from our analysis.
Thus, as an investor, we can examine the returns to three asset classes over time:
- U.S. stocks
- U.S. 10-Year Treasury Bonds
- U.S. Treasury Bills (i.e. the return to cash)
So, given the goal of achieving the highest returns possible, while accepting volatility, let’s examine the second step, which is to come up with a investment process to achieve the goal. In order to do that, let’s at least examine the past, similar to how we noted above that most NBA teams with a championship had a great player on their team.
In order to assess the past, I show the annualized total returns from 1/1/1927 through 12/31/1999. All portfolios are gross of any transaction or management fees.
| U.S. Stocks (SP500) | U.S. 10-Year Bond | U.S. T-bills (RF) | |
|---|---|---|---|
| CAGR | 11.12% | 5.09% | 3.79% |
| Standard Deviation | 19.78% | 7.05% | 0.91% |
| Sharpe Ratio | 0.44 | 0.21 | 0.00 |
The results are hypothetical results and are NOT an indicator of future results and do NOT represent returns that any investor actually attained. Indexes are unmanaged, do not reflect management or trading fees, and one cannot invest directly in an index.
Given the average returns over that 70+ year period, the “investment process” seems rather simple–invest in stocks (even though they are much more volatile).
Let’s pretend that on 12/31/1999 a financial advisor walks in the door with a nice suit and attempts to convince you to invest in stocks are the best way to compound your money. The advisor may show the table above, or may even show the chart below, non-log scale (1) to annoy Fin-Twit 18 years later and (2) to highlight that for some reason, the human brain (for most people) does not understand the power of compounding.
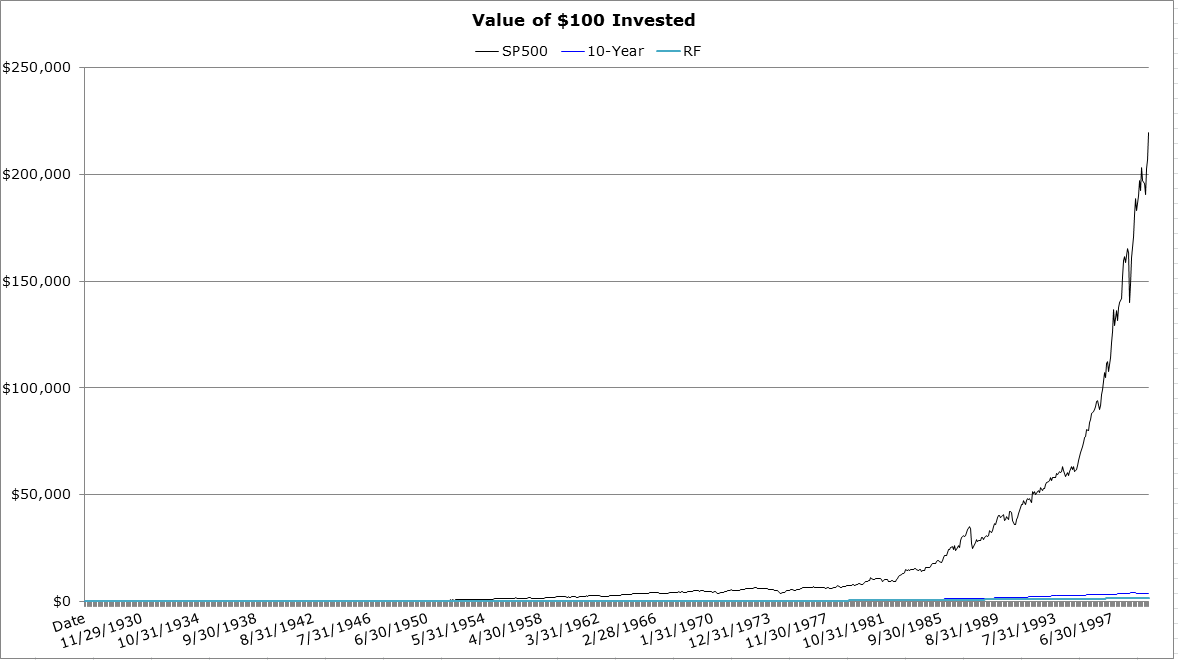
The chart is correct–$100 invested on 1/1/1927 becomes the following on 12/31/1999:
- U.S. Stocks: $219,874.48
- U.S. T-Bonds: $3,753.68
- U.S. T-Bills (cash): $1,507.15
In addition to the chart above, you hear through the news and from your neighbors that they have made a ton of money in new “tech” stocks. So you have been primed to make the plunge into stocks–and you sign up with your new advisor.
Now let’s say a more conservative advisor attempts to sell you another stock portfolio; however, since the advisor wants to make sure you fully understand what “volatility” is, he shows the annual performance of stocks from 1/1/1927-12/31/1999. You note that there are numerous years with massive losses, such as the following:
- 1930: -26.33%
- 1931: -45.65%
- 1937: -36.05
- 1973: -14.81%
- 1974: -26.42%
The advisor does this in an attempt to be upfront and honest, and let you know that stocks can be very volatile and you can have potentially large drawdowns.
However, even given this information, you note that while stocks can be very volatile and have large drawdowns, you have a long time horizon (10+ years), so you make the plunge and invest in stocks. You even go to Vanguard, as you have read that no one can beat the market. So you simply invest in the SP500 mutual fund, moving your portfolio out of cash and bonds.(4)
So let’s re-examine our three steps:
- Goal: Compound my money at the highest rate.(5)
- Process and logic: Invest in stocks. Even though they are volatile and have drawdowns, they had the highest rate of return in the past. Invest 100% in the passive index, as no one can beat the market.
- Can I trust the investment process?
Now let’s examine the next 10 years of returns to our three asset classes.
The annualized Compound Annual Growth Rate (CAGR) over this 10-year stretch (1/1/2000 – 12/31/2009) is shown below. All portfolios are gross of any transaction or management fees.
| U.S. Stocks (SP500) | U.S. 10-Year Bond | U.S. T-bills (RF) | |
|---|---|---|---|
| CAGR | -0.68% | 8.21% | 2.77% |
| Standard Deviation | 16.06% | 6.87% | 0.55% |
| Sharpe Ratio | -0.13 | 0.79 | 0.00 |
The results are hypothetical results and are NOT an indicator of future results and do NOT represent returns that any investor actually attained. Indexes are unmanaged, do not reflect management or trading fees, and one cannot invest directly in an index.
In addition, here is the invested growth, once again non-log scale over the 1/1/2000 – 12/31/2009 period.
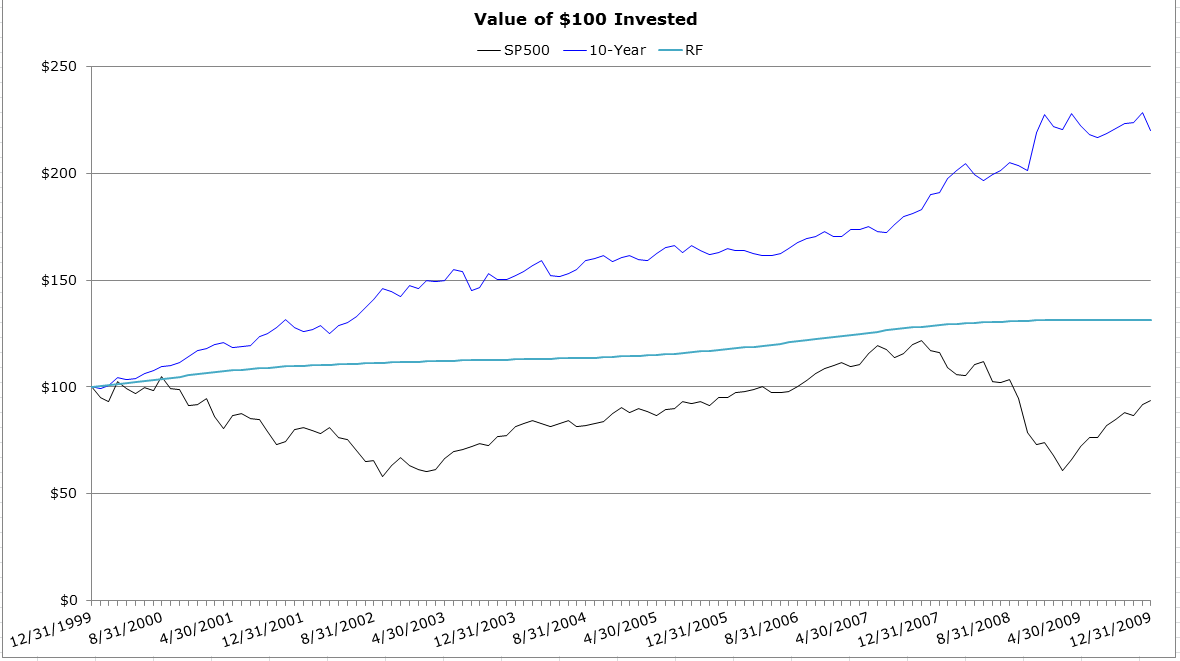
So what does one do after experiencing a 10-year stretch of horrible outperformance to the simple alternatives: cash and bonds?
Can you trust the investment process?
For some, unfortunately, the answer may have been no.
For those who stayed invested, here are the returns from 1/1/2010 – 12/31/2017. All portfolios are gross of any transaction or management fees.
| U.S. Stocks (SP500) | U.S. 10-Year Bond | U.S. T-bills (RF) | |
|---|---|---|---|
| CAGR | 13.96% | 3.67% | 0.20% |
| Standard Deviation | 11.98% | 4.55% | 0.09% |
| Sharpe Ratio | 1.14 | 0.77 | 0.00 |
The results are hypothetical results and are NOT an indicator of future results and do NOT represent returns that any investor actually attained. Indexes are unmanaged, do not reflect management or trading fees, and one cannot invest directly in an index.
Luckily for stockholders, the more recent returns were most likely in line with their original expectations–higher returns than both bonds and cash. These results also highlight that at the moment when one would potentially make a change and alter the investment process (the depths of 2009), this is generally a bad time to do so.(6)
Below are the results over the past 18 years, from 1/1/2000 – 12/31/2017.
| U.S. Stocks (SP500) | U.S. 10-Year Bond | U.S. T-bills (RF) | |
|---|---|---|---|
| CAGR | 5.58% | 6.17% | 1.62% |
| Standard Deviation | 14.48% | 5.97% | 0.55% |
| Sharpe Ratio | 0.34 | 0.77 | 0.00 |
The results are hypothetical results and are NOT an indicator of future results and do NOT represent returns that any investor actually attained. Indexes are unmanaged, do not reflect management or trading fees, and one cannot invest directly in an index.
So over this 18 year period, even with the most recent high returns to U.S. stocks, one notices that stocks have still lost to bonds!
That was not even a consideration 18 years ago. So even now, given the higher volatility of stocks over an 18-year out of sample period, one may begin to question the investment process.
Now many may read this and just state that I cherry-picked one of the worst times to start an all-equity portfolio. And the answer is yes, I did, and this was intentional.(7). And given the long time period examined, there is a low probability that January 1, 2000, would have been one’s starting point to invest 100% in the market.
However, this was done to bring us back to the original question–Do I trust the investment process?
Better yet, did I even truly understand the investment process when I initially invested?
Probably not–however, now is a good time to dig in and learn more.(8)
First off, why should I even expect stocks to outperform bonds in the first place?
A great question! This is the so-called “equity premium puzzle“, (our write up here) which is the inability of standard economic models to understand why stocks have outperformed bonds over the past 100 years (especially in the U.S.). Without getting into too much detail, a reasonable explanation is that since stocks are more volatile and investors are risk-averse, equities have rewarded the “riskier” investment(9) with higher returns. Yes, markets are pretty efficient–one receives a higher reward for taking on additional risk!
So to the extent that stocks are riskier than bonds in the future, they should demand a higher rate of return in an efficient market.(10)
Thus, equity investors should generally continue to trust the investment process if the goal is a higher rate of return (while accepting volatility).
But what if one not only wanted to invest in stocks, but they wanted to be like Warren and beat the stock market. How can one go about achieving this goal?
We examine this below.
Example 2: Trying to Beat the Benchmark
Once one decides to invest in stocks, there are two approaches, (1) invest passively in the market-cap weighted portfolio or (2) attempt to beat the benchmark. If one invests passively, they can do this cheaply by using mutual funds and ETFs that charge very low management fees. For those that attempt to beat the benchmark, they can do this two ways, (1) through their own stock selection or (2) by using mutual funds or ETFs that they believe have a solid strategy.(11)
So here the goal is rather simple–invest in stocks and attempt to beat the benchmark.
Given that goal, is there an investment process that one can follow in an attempt to beat the benchmark?
We will start with the assumption that just randomly picking stocks is a bad idea, after a few years of failing. With that baseline assumption, let’s turn to the evidence in the past–what systematic strategies have been shown to work?
After reading the journals in the 1990s, one comes away with the conclusion that a few strategies worked in the past:(12)
- Value Investing–Purchasing stocks that are cheap on some measure, such as the price of the stock divided by its earnings (P/E ratio)
- Momentum Investing–Purchasing stocks that have done the best over the past year, when examining the total return over the past year (i.e. 12 months).
So what is the evidence?
Below are the returns to the top and bottom decile portfolios sorted on either Value or Momentum from 1/1/1927-12/31/2017. The data is from Ken French’s website, using the market-cap-weighted-portfolio returns, and using book-to-market (B/M) as the Value portfolio and “12_2 momentum” as the Momentum portfolio.(13)
Here are the 5 portfolios we will examine:
- SP500 — the S&P 500
- Value — the top decile of firms ranked annually on June 30th on their book-to-market (B/M) ratio. Higher B/M ratios indicate the firms are “cheaper.”
- Growth — the bottom decile of firms ranked annually on June 30th on their book-to-market (B/M) ratio. Lower B/M ratios indicate the firms are “expensive.”
- High Momentum — the top decile of firms ranked monthly on their total returns over the past 12 months, ignoring the last month (i.e. 12_2 momentum). These are firms that have had the “best” returns over the past year.
- Low Momentum — the bottom decile of firms ranked monthly on their total returns over the past 12 months, ignoring the last month (i.e. 12_2 momentum). These are firms that have had the “worst” returns over the past year.
The returns below are from 1/1/1927-12/31/2017. All portfolios are gross of any transaction or management fees.
| SP500 | Value | Growth | High Momentum | Low Momentum | |
| CAGR | 10.00% | 11.98% | 8.75% | 16.70% | -1.38% |
| Standard Deviation | 18.86% | 31.92% | 19.70% | 22.34% | 33.74% |
| Sharpe | 0.43 | 0.40 | 0.36 | 0.66 | 0.02 |
The results are hypothetical results and are NOT an indicator of future results and do NOT represent returns that any investor actually attained. Indexes are unmanaged, do not reflect management or trading fees, and one cannot invest directly in an index.
Based on the evidence above, there are three takeaways:
- Never invest in low momentum stocks!
- In the past, Value stocks outperformed both Growth stocks and the market (SP500), at least on paper portfolios.
- In the past, High Momentum stocks outperformed Low Momentum stocks and the market (SP500), at least on paper portfolios.
Now, of course, trading costs will have an impact. Read our article on factor investing and trading costs.
But let’s assume that one is comfortable that the Value and Momentum factors will survive trading costs. In addition, you have read the academic literature that says that Value has worked in the past, such as Fama and French (1993) as well as Lakonishok, Shleifer, and Vishny (LSV 1994). You do the same for momentum (JT 1993).
Based on the evidence, the investment process seems rather simple–invest in Value and Momentum stocks.
Going back to our three steps, we have the following:
- Goal: Invest in stocks and attempt to beat the benchmark.
- Process and logic: Invest in Value and Momentum portfolios. The evidence shows that in the past, these portfolios have outperformed the benchmark and there is research showing that these premiums appear to exist due to either (1) risk or (2) behavioral errors.
- Can I trust the investment process?
Now the last part here is tricky–can I trust the investment process?
But why is this difficult?
Well, when one simply examines summary statistics they are just that, summary statistics. But the journey is just as important.
What do I mean by this?
For example, here are the returns to Value, Momentum, and the Market since 1/1/2008, so these are the past 10 years of returns using the same portfolios described above. All portfolios are gross of any transaction or management fees.
| SP500 | Value | High Momentum | |
|---|---|---|---|
| CAGR | 8.62% | 4.94% | 8.36% |
| Standard Deviation | 15.02% | 28.96% | 19.75% |
| Sharpe Ratio | 0.61 | 0.30 | 0.49 |
The results are hypothetical results and are NOT an indicator of future results and do NOT represent returns that any investor actually attained. Indexes are unmanaged, do not reflect management or trading fees, and one cannot invest directly in an index.
So over the past 10 years, our two investment processes, Value and Momentum, have underperformed the benchmark! Not only that, the benchmark costs next to nothing, it is almost free! So for 10 years, one would have spent either (1) additional time running their own value and momentum portfolios or (2) paid higher management fees, all in exchange for lower rates of return! In addition, this has happened in other 10-year periods in the past as well, not just the most recent 10-years!
Can you still trust the investment process?
At this point, it is fine to ask tough questions.
Why would one expect Value stocks to outperform in the first place?
Luckily, academics have been asking that question for decades. They have found that value stocks outperformed in the past due to two reasons:
1) Risk — i.e. Value stocks are inherently riskier
2) Behavior — Investors overreact to past accounting information, driving the prices too low for value stocks and too high for growth stocks.
Similar arguments are made for momentum investing.
However, to be clear and upfront, investing in Value and Momentum portfolios is not the same as investing in the index. There will be tracking error and potentially the factor will not work in the future, even over 10-year periods.
If Value and Momentum stocks are inherently riskier than the market in general, they should demand higher returns in the future. Also, if investors make systematic behavioral errors, such as overreaction for Value and underreaction for Momentum, this would add to their returns in the future. So we believe that Value and Momentum will continue to work in the future, but not everyone has to agree.(14)
As we have pointed out here, systematic factor investing can be simple, but definitely not easy.
Below we examine the last example of an investment process that appears to be simple and sustainable, but for many can be difficult to trust–trend-following.
Example 3: Try to Reduce Drawdowns and Volatility
Of course, the holy grail of investing is the following–get high returns with no drawdowns.
Who doesn’t want that!?
So we have our third goal–achieve stock-like returns (high) with lower drawdowns.
But is there a way to achieve this goal?
We already stated above that from 1/1/2000-12/31/2009, U.S. stocks (S&P 500) had a negative return. In fact, this was a horrible time to begin investing in stocks. Now, what if, on 1/1/2010 someone walks into the door and says the following:
My approach is very simple, I simply invest in stocks when the market is trending up, and get out of stocks when the market is trending down.
Sounds reasonable.
But what are the results?
Luckily for you, the advisor has backtested returns to show you over a 10-year period, from 1/1/2000-12/31/2009.
The four portfolios are listed below:
- Sp500 (trend) — Every month, see if the SP500 total return price index is above its 12-month average. If the current total return price index is above the average (i.e. trending up), stay invested in the SP500. If the current total return price index is below the average (i.e. trending down), invest in cash (U.S. T-bills, or the risk-free asset).
- SP500 — Invests 100% of the time in the SP500.
- EAFE (trend) — Every month, assess to see if the EAFE total return price index is above its 12-month average. If the current total return price index is above the average (i.e. trending up), stay invested in the EAFE. If the current total return price index is below the average (i.e. trending down), invest in cash (U.S. T-bills, or the risk-free asset).
- EAFE — Invests 100% of the time in the EAFE.(15)
The returns below are from 1/1/2000-12/31/2009. All portfolios are gross of any transaction or management fees.
| SP500 (trend) | SP500 | EAFE (trend) | EAFE | |
| CAGR | 5.64% | -0.68% | 10.49% | 1.17% |
| Standard Deviation | 8.66% | 16.06% | 9.29% | 17.82% |
| Sharpe | 0.36 | -0.13 | 0.83 | 0.00 |
| Maximum Drawdown | -14.37% | -50.21% | -14.20% | -56.68% |
The results are hypothetical results and are NOT an indicator of future results and do NOT represent returns that any investor actually attained. Indexes are unmanaged, do not reflect management or trading fees, and one cannot invest directly in an index.
Given this information, you have found the holy grail of investing!
Higher returns, lower standard deviations, and most importantly, lower drawdowns!
Where do I sign up?
So we have the holy grail and our investment process.
Going back to our three steps, we have the following:
- Goal: Achieve stock-like returns (high) with lower drawdowns
- Process and logic: Invest in stocks, but apply trend-following rules. Based on human psychology, this appears to be logical, as almost everything in life ebbs and flows, and trends occur in almost all fields.
- Can I trust the investment process?
At the outset, some may even dismiss the “can I trust the investment process” question. After all, this seems like a slam dunk.
So after implementing the strategy on 1/1/2010, how has the trend-followed portfolio done? We examine this below.
The returns below are from 1/1/2010-12/31/2017. All portfolios are gross of any transaction or management fees.
| SP500 (trend) | SP500 | EAFE (trend) | EAFE | |
| CAGR | 8.97% | 13.96% | 2.85% | 6.25% |
| Standard Deviation | 9.81% | 11.98% | 10.38% | 15.06% |
| Sharpe | 0.91 | 1.14 | 0.30 | 0.47 |
| Maximum Drawdown | -16.88% | -16.26% | -17.33% | -22.83% |
The results are hypothetical results and are NOT an indicator of future results and do NOT represent returns that any investor actually attained. Indexes are unmanaged, do not reflect management or trading fees, and one cannot invest directly in an index.
The results above highlight that over the past 8 years, a trend-followed portfolio has underperformed the “free” benchmark indices. To add insult to injury, you probably also paid additional taxes on selling when the trend rules were triggered.
Can you trust the investment process?
So once again, we need to sit back and examine the investment process. Does it really make sense to invest in a trend-followed portfolio? After all, academics for years have argued that trend following is worthless and a waste of time.
Maybe I should listen to the ivory tower. Or at least get a better understanding as to why they say that trend-following is worthless. So what exactly are they testing? Well, the academics compare trend-followed portfolios to buy-and-hold (B&H), to examine whether or not the return sequence or Sharpe ratios are statistically significant from one another. In general, they do not find statistical significance.(16)
So let’s dig into trend-following a little more, to better understand how it works.
To give some broader context to trend-following, I am displaying the returns to trend-followed portfolios on the five major asset classes:
- SP500 — SP500 total return
- EAFE — EAFE total return
- T-Bond — U.S. 10-Year Treasury Bond total return
- REITs — NARIET index total return
- Commodities — GCSI index total return
The portfolios and their returns are shown first without trend, and then with trend-following.
The returns below are from 1/1/1973-12/31/2017. All portfolios are gross of any transaction or management fees.
| SP500 | EAFE | T-Bond | REITs | Commodities | |
| CAGR | 10.52% | 8.49% | 7.75% | 11.94% | 5.84% |
| Standard Deviation | 15.14% | 17.03% | 8.15% | 16.88% | 20.34% |
| Sharpe | 0.43 | 0.29 | 0.39 | 0.48 | 0.15 |
| Maximum Drawdown | -50.21% | -56.68% | -20.97% | -68.30% | -80.90% |
The results are hypothetical results and are NOT an indicator of future results and do NOT represent returns that any investor actually attained. Indexes are unmanaged, do not reflect management or trading fees, and one cannot invest directly in an index.
The returns below are from 1/1/1973-12/31/2017. All asset classes apply a 12-month moving average rule to the total return index, and either invest (1) in the index if a positive trend or (2) in cash (U.S. T-bills) is a negative trend. All portfolios are gross of any transaction or management fees.
| SP500 (trend) | EAFE (trend) | T-Bond (trend) | REITs (trend) | Commodities (trend) | |
| CAGR | 10.87% | 9.85% | 7.67% | 11.57% | 8.12% |
| Standard Deviation | 11.58% | 12.10% | 6.88% | 12.03% | 16.26% |
| Sharpe | 0.55 | 0.45 | 0.43 | 0.59 | 0.27 |
| Maximum Drawdown | -23.58% | -21.08% | -11.26% | -20.77% | -57.41% |
The results are hypothetical results and are NOT an indicator of future results and do NOT represent returns that any investor actually attained. Indexes are unmanaged, do not reflect management or trading fees, and one cannot invest directly in an index.
As is shown above, the overall annualized returns to trend-followed portfolios, over long-time cycles, are definitely not that much different than B&H. This is why many academics have argued against using trend-following rules. In addition, academics generally scoff at the idea of “maximum drawdown”, as they prefer to focus on volatility or risk-adjusted returns, such as the Sharpe ratio.(17)
At a high level, if you believe B&H is the best way to invest, that is great. If you cannot accept large drawdowns, trend-following is one approach to attempt to lower the drawdowns on any asset class. However, as shown in the most recent 8 years, there is no free lunch. If one invests in the trend-followed portfolio during a time period with no large drawdown, it will most likely underperform the B&H portfolio. This is due to whipsaws, where the trend-following rules tell you to get “out” of the asset class, only for the price to move higher once you are in cash.
Trend-following is a decent approach, but it is not perfect and definitely does not work all the time.
For more details on trend-following, here is an article with more details.
Trusting the Investment Process has its challenges
In our basketball example, it is pretty easy to ascertain whether or not the investment process makes sense. Seeing Joel Embiid dunk over someone or have a great block is visible. Similarly, in life, most processes generate quick results that are visible. For example, let’s say your goal is to lose weight and your process is to (1) eat better and (2) work-out more. If that process is followed for a few weeks, you will see results, which can lead you to continue to “trust the process.”
When it comes to investing, answering the question, “Can I trust the Investment Process?” is very hard. Sometimes the investment process will not work over long periods, which can make trusting the investment process even harder.
The three examples given above were not necessarily out of the blue, as these are approaches to investing that we believe in:
- Stocks will have higher returns than bonds in the long run.(18)
- Value and Momentum are two ways one can attempt to beat the benchmark.
- Trend-following is a decent attempt to lower drawdowns on all asset classes.
Yes, we are fans of equity investing, as well as the value, momentum, and trend factors.
Conclusions on trusting an Investment Process
The goal of this article was to highlight that even though we believe these three items, trusting the investment process can still be very hard. I tried to show a bad scenario for the three beliefs we have, in an attempt to give a better description of what the investment process is up-front, in an attempt to minimize regret in the future.
In general, the best solution is probably to assess the information in a calm setting, come to a conclusion about an approach, and then sit back and “trust the investment process.”
Please let us know what you think …
References[+]
| ↑1 | While the process carries on, Sam is no longer with us on the Process.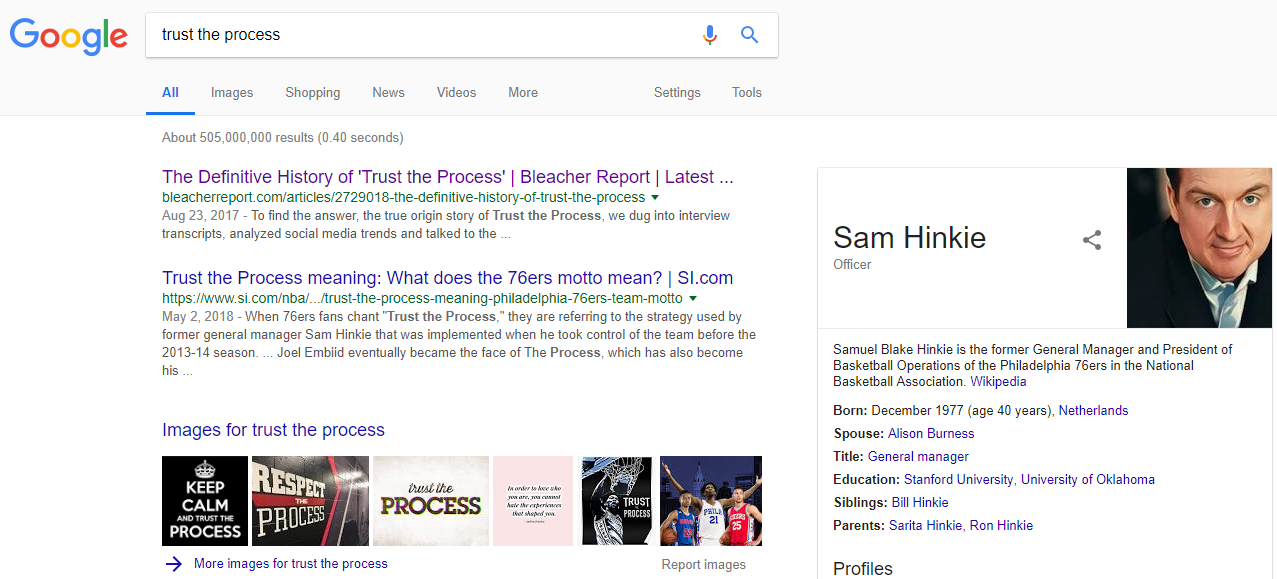 |
|---|---|
| ↑2 | OSAM has an interesting podcast with Sam Hinkie here. |
| ↑3 | Note this list is not exhaustive, as there are other players who won multiple championships. Rather, these are the players one would consider to be the “leader” of their teams on multiple championships. For example, Robert Horry won seven championships over this time period, the most of all players, yet he was never considered the “leader” of his respective teams. |
| ↑4 | Note: Here is a neat article by Buffett in November of 1999 noting that investors expecting 11 or 12% annualized were probably going to be disappointed. |
| ↑5 | Assuming one can invest in (1) U.S. stocks, (2) U.S. T-Bonds, and (3) U.S. T-bills (cash) |
| ↑6 | Once again, this is a generality. |
| ↑7 | I did not check all perturbations to see which is the worst, my assumption is that ending in March 2009 |
| ↑8 | Note–it is always a good idea to keep learning! |
| ↑9 | As measured with standard deviation |
| ↑10 | Given the high market valuations in 1999, this was a bad time to begin investing in stocks, as valuations compressed over the next 10 years. Also note that the starting 10-year yield was 6.11% on 10/31/1999, whereas the starting CAPE ratio was 40.55–data from Robert Shiller’s website. However, trusting the investment process should entail a deeper understanding of what one can expect returns to be for stocks going forward. Read our post on future expected return models , and here is a neat tool by Research Affiliates to visually inspect expected returns. |
| ↑11 | Note it could be the case that some investors do not care how the benchmark does, and they simply want to track their own investment process, such as investing in stocks with high dividend yields. For those that do not compare themselves to the benchmark, they actually may be better off from a behavioral standpoint and long-term success. |
| ↑12 | We will ignore the size factor here. |
| ↑13 | Note this is the total return to stocks over the past 12 months, ignoring last month, and is called 12_2 momentum in the academic community |
| ↑14 | If you don’t agree, then a great solution is to simply invest in the market-cap weighted index. |
| ↑15 | Note that the EAFE index invests in developed international stock markets |
| ↑16 | Note that there are academic papers arguing trend-following works, but there are also papers attempt to refute trend-following. Note this list of two references is not exhaustive. |
| ↑17 | That maybe a biased sentence, but Wes and I wrote a paper on maximum drawdowns and were basically laughed off the floor by some academics. |
| ↑18 | Assuming stocks are riskier than bonds, in an efficient market |
About the Author: Jack Vogel, PhD
—
Important Disclosures
For informational and educational purposes only and should not be construed as specific investment, accounting, legal, or tax advice. Certain information is deemed to be reliable, but its accuracy and completeness cannot be guaranteed. Third party information may become outdated or otherwise superseded without notice. Neither the Securities and Exchange Commission (SEC) nor any other federal or state agency has approved, determined the accuracy, or confirmed the adequacy of this article.
The views and opinions expressed herein are those of the author and do not necessarily reflect the views of Alpha Architect, its affiliates or its employees. Our full disclosures are available here. Definitions of common statistics used in our analysis are available here (towards the bottom).
Join thousands of other readers and subscribe to our blog.