The financial equivalent of the famous Miller Lite, “tastes great, less filling” debate is the debate between traditional financial economics which uses risk theories to explain asset pricing and the newer behavioral finance field that uses human behavior to provide the explanations. Unfortunately, there’s no consensus on which side of the debate is correct. My own view is that both have much to contribute to the discussion. In other words, the story isn’t all one-sided — it’s not black or white, it’s some shade of grey. With that in mind, we’ll look into the research on the source of the value premium: Is it risk-based or behavioral-based?
Value investing refers to buying stocks of companies with low multiples relative to fundamental metrics such as book value, earnings, cash flow, EBITDA, and so on. It’s often referred to as buying what is cheap—as opposed to growth investing which buys companies with high prices relative to fundamental metrics, and, thus, referred to as expensive. There is no debate about whether value stocks have outperformed growth stocks, on average. Historically, cheaper stocks have earned higher returns than expensive stocks.
The only debate is why.
Stephen Penman and Francesco Reggiani contribute to the literature on the value premium with their study “Fundamentals of Value versus Growth Investing and an Explanation for the Value Trap” which appears in the 2018 fourth quarter edition of the Financial Analysts Journal. They sought to explain the source of the value premium by examining fundamental accounting data. They begin by noting that when buying a stock you are buying future earnings and price multiples imbed expectations of earnings growth—higher expected growth means higher P/E (lower E/P). Because there is risk that the forecasts may not be realized, the market also prices risk via the discount rate applied to the earnings estimates—greater risk means lower P/E (higher E/P). Markets price both risk and earnings growth. Thus, you can have an expectation of high earnings growth and a low price to earnings or price to book value because that earnings growth is viewed as being at high risk of not being realized. In other words, value stocks may be cheap (have a low P/E) because they are highly risky—hence the term “value traps”. Conversely, you can have an expectation of low earnings growth and a high price-to- earnings or price to book value because that earnings growth is viewed as being at low risk of not being realized. Penman and Reggiani summarize:
For a given E/P [earnings-to-price], a high B/P [book value-to-price] indicates a higher likelihood that growth will not be realized. While a high B/P stock might look cheap, that could be a trap.
Three main points emerge from their study which covers the period from 1963 through 2015:
- E/P and B/P multiples should be employed together as they convey risk and the expected return for that risk.
- When applied jointly with E/P, high B/P (a value stock) indicates higher future earnings growth. For
many this will seem surprising as the standard labeling implies that it is low B/P that buys growth, not value.
- The higher growth associated with high B/P is risky—high B/P stocks are subject to more extreme shocks to growth.
A major contribution of the paper is that their analysis explains the puzzle observed in value versus growth investing—why B/P has much greater predictive value (a much larger premium) for small firms than large firms, and why, for large firms, E/P dominates B/P in predicting returns. “These differences are explained by relative exposure to growth at risk, an exposure indicated by the accounting fundamentals. Indeed, returns to investing by firm size can be explained by exposure to risky growth.” The bottom line is that larger stocks have greater certainty (less risk) in expected growth, and, thus, a lower premium.
Penman and Reggiani ranked firms on their E/P ratios, forming five portfolios from low to high E/P, with the first portfolio being all firms with losses. Within each E/P portfolio, they ranked firms on their B/P and formed five portfolios. They found that E/P monotonically ranks returns for portfolios 2 through 5 and that for a given E/P, B/P ranks returns. For equal-weighted portfolios, “the mean return spread between the 1.9% return for the low-E/P and low-B/P portfolio and the 27.1% return for the high-E/P and high-B/P portfolio….is quite impressive.” The spread of 25.2 percent came with a t-stat of 5.6. The high minus low spreads were also large and statistically significant (at least at the 5 percent confidence level) across the other four portfolios. However, the results were not as impressive or significant when looking at value-weighted portfolios. While the mean return spread between the low-E/P and low-B/P portfolio and the return for the high-E/P and high-B/P portfolio was still an impressive 10.8 (t-stat of 2.49), none of the other four portfolios had statistically significant spreads, and one of the four had a negative spread. This indicates that the explanatory power of the data is only strong for the smallest stocks, limiting the practical and economic implications. It also implicitly confirms that the book-to-price “value” effect is much reduced in large firms
Value Connects to Profitability and Risk
By walking through the basic accounting principles, Penman and Reggiani showed why value connects to low profitability and why that connection implies risky outcomes. Their explanations are also consistent with the findings from prior research.
For example:
- Nai-fu Chen and Feng Zhang, authors of the study “Risk and Return of Value Stocks” found that value stocks have a high standard deviation of earnings.
- Lu Zhang, author of the study “The Value Premium.” concluded that the value premium could be explained by the asymmetric risk of value stocks. Value stocks are much riskier than growth stocks in bad economic times and only moderately less risky than growth stocks in good times.
- Ralitsa Petkova, author of the “Do the Fama-French Factors Proxy for Innovations in Predictive Variables?” found that value companies tend to be firms under distress, with high leverage and high uncertainty of cash flow.
In summary, the academic research demonstrates that value firms have riskier earnings and profitability compared to growth firms. These are intuitive risk-based explanations for the premium.
Given E/P, B/P is Positively Related to Subsequent Earnings Growth
Penman and Reggiani next showed that for a given E/P, B/P is positively related to subsequent earnings growth. Ranking stocks first by E/P and then B/P, they created the same 25 portfolios. They then examined the mean earnings growth rates two years ahead for these portfolios. They found that E/P predicts subsequent earnings growth (higher P/E, lower E/P, predicts higher growth in earnings). However, for a given E/P, B/P is positively correlated with growth, with the difference in growth rates particularly strong for lower E/P portfolios with the higher growth expectations. For example, earnings growth was 41 percent for the low E/P, high B/P portfolio versus -12.5 percent for the high E/P, low B/P portfolio. All of the data was statistically significant with t-stats ranging from 6.5 to 2.0.
By sorting stocks based on the volatility of next year’s earnings, Penman and Reggiani documented that the higher earnings growth in the low E/P, high B/P portfolio came with greater risk to those earnings. They showed that for a given E/P, B/P is positively associated with subsequent earnings growth risk. A higher B/P indicates that one is buying both riskier forward earnings and subsequent earnings growth. This was true for all levels of E/P, including high E/P (“value”) and low E/P (“growth”). It was also true for negative E/P (loss firms) that are often associated with particularly strong expensing of investment. For example, the standard deviation of one-year ahead realized earnings for the high E/P, low B/P portfolio was 4.5 percent versus 13.9 percent for the low E/P, high B/P portfolio. At the two-year horizon the figures were 14.3 percent and 26.3 percent, respectively. Connecting the variance of growth rates to that of stock returns, they found that the correlation between the standard deviation of earnings growth rates for the B/P portfolios with the standard deviation of returns in the same year as the growth realizations was 0.69. They concluded that not only does B/P indicate expected growth but also the variance around that expectation. B/P indicates whether a given E/P is one with high growth and risk or low growth and risk—B/P indicates a higher chance of a high-growth outcome but also a higher chance of growth falling in the lower tail.
Diversifiable or Systematic Risk?
Under asset pricing theory, risk is priced only if it pertains to sensitivity to risk that cannot be diversified away. With that in mind, Penman and Reggiani looked to see if risk to earnings is associated with shocks to market-wide earnings. Separating years in which the market-wide earnings yield was up from the previous year (up-markets) from years when it was down (down-markets), they found that high B/P stocks have higher up-market betas, delivering higher earnings in good times, but also have higher down-market betas, a trap that is compensated with higher upside potential. Correspondingly, low B/P portfolios have considerably lower betas in down-markets, but their upside beta is also lower. For example, the high E/P, low B/P portfolio has a conditional up-market beta of 1.24 versus 2.41 for the low E/P, High B/P portfolio. The down-market betas were 0.70 for the high E/P, low B/P portfolio and 5.02 for the low E/P, high B/P portfolio. They concluded that the variation in earnings outcomes across B/P portfolios is due, in part, to economy-wide shocks—systematic risks that cannot be diversified away, and that the spread in portfolio returns can be interpreted as compensation for bearing risk. They do also note that the abnormal (alpha) returns could be a result of the market mispricing earnings growth. In support of the risk explanation they cite the results from 2008 when growth expectations took a large hit, and the spreads were negative for all E/P portfolios: for a given E/P, high B/P (and low ROE) earned lower returns than low B/P (high ROE).
Firm Size and Value vs. Growth Investing
As noted earlier, the spreads for value-weighted returns are lower than those for equally-weighted returns, suggesting that the phenomena is stronger in small firms than large firms—which is logical as small firms are more likely to be growth prospects, but with growth that is more at risk. The flip side is that large firms are those with lower growth prospects, but growth is less risky. That explains why the value premium for B/P has been much greater in small stocks than in large stocks—B/P plays no role (incremental to E/P) when there is little expected growth at risk. In addition, Penman and Reggiani found that for a given E/P, the return spread between high and low B/P portfolios is decreasing in firm size and that the B/P return spread is negligible for large firms in all E/P portfolios. They also found that in the (E/P, B/P) pairs reported for the quintiles, E/P is increasing in firm size, but B/P is decreasing.
Penman and Reggiani examined another measure, the earnings grow beta, which measures the sensitivity of earning growth to variation of market-wide growth rates. They found that these betas are also decreasing in firm size.
Summarizing, when buying “value” firms with low multiples, investors may be taking on risk of buying earnings growth that may not materialize. A relatively high E/P stock, a so-called “value” stock, is typically viewed as one with low growth expectations. However, it could be one with high growth expectations with the growth being risky.
Penman and Reggiani provide support for a risk-based explanation for the value premium. However, as I noted, there is a great debate, with literature also providing behavioral explanations.
The Behavioral Side of the Tale
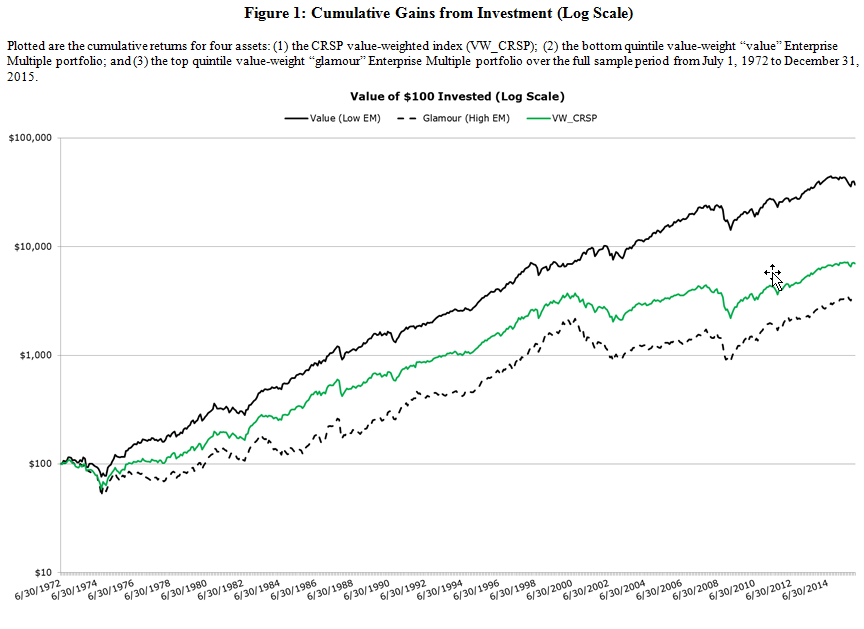
To take a look at the research supporting a behavioral explanation we can examine the findings of the study “Why do Enterprise Multiples Predict Expected Stock Returns?” The authors, Steven S. Crawford, Wesley Gray, and Jack Vogel, examined the returns to the enterprise factor over the period from 1972 through 2015. The enterprise multiple is calculated as enterprise value (EV = equity + debt + preferred stock – cash) divided by earnings before interest taxes depreciation and amortization (EBITDA = operating income before depreciation and amortization). They found that consistent with the existing literature, there has been a strong enterprise multiple (EM) premium in the U.S.—low EM firms significantly outperform high EM firms.
They then focused on the great debate—investigating whether high average expected returns associated with value stocks and low average expected returns earned by glamour stocks are compensation for risk or a result of systematic mispricing. To understand what drives the EM effect, they used the work of Joseph D. Piotroski and Eric C. So, authors of the 2011 study “Identifying Expectation Errors in Value/Glamour Strategies: A Fundamental Analysis Approach” to help differentiate between the risk-based and the mispricing-based hypotheses. Piotroski and So classified and allocated observations into value and glamour (growth) portfolios on the basis of each firm’s B/M ratio. A firm’s B/M ratio reflects the market’s expectations about future performance. Firms with higher expectations will have higher prices and a lower BtM ratio, while conversely, firms with weak expectations will have lower prices and a higher BtM ratio. Thus, the book-to-market ratio serves as a proxy for the relative strength of the market’s expectations about a firm’s future performance.
Piotroski and So classified a firm’s financial strength by utilizing the aggregate statistic F-Score, which is based on nine financial signals designed to measure three different dimensions of a firm’s financial condition: profitability, change in financial leverage/liquidity and change in operational efficiency. The F-Score is an early example of a composite quality factor (such as the QMJ, or quality minus junk, developed by AQR Capital). Firms with the poorest signals have the greatest deterioration in fundamentals and are classified as low F-Score firms. Firms receiving the highest score have the greatest improvement in fundamentals and are classified as high F-Score firms. Prior research demonstrated that the F-Score is positively correlated with future earnings growth and future profitability levels: Low F-Score firms experience continued deterioration in future profitability and high F-SCORE firms experience overall improvement in profitability.
The following is a summary of Piotroski and So’s findings:
- Among firms where the expectations implied by their current value/glamour classification were consistent with the strength of their fundamentals, the value/glamour effect in realized returns is statistically and economically indistinguishable from zero, arguing against a risk-based explanation.
- The returns to traditional value/glamour strategies are concentrated among those firms where the expectations implied by their current value/glamour classification are incongruent
ex ante with the strength of their fundamentals.
- Returns to this “incongruent value/glamour strategy” are robust and significantly larger than the average return generated by a traditional value/glamour strategy.
In the academic literature, the explanation for the mispricing of value stocks relative to growth stocks is that behavioral errors, such as optimism, anchoring and confirmation biases, cause investors to underweight or ignore contrarian information. As Piotroski and So noted, “Investors in glamour stocks are likely to under-react to information that contradicts their beliefs about firms’ growth prospects or reflect the effects of mean reversion in performance. Similarly, value stocks, being inherently more distressed than glamour stocks, tend to be neglected by investors; as a result, performance expectations for value firms may be too pessimistic and reflect improvements in fundamentals too slowly.”
Piotroski and So’s findings were consistent with the mispricing explanations for the value premium. They found that the value/glamour effect was concentrated among the subset of firms where expectations implied by book-to-market ratios were not aligned with the strength of the firms’ fundamentals (F-Score). And more importantly, the value/glamour effect was nonexistent among firms where expectations in price were aligned with the strength of the firm’s recent fundamentals. They concluded that firms with low book-to-market ratios and low F-Scores (weak fundamentals) were persistently overvalued, and firms with high book-to-market ratios and high F-Scores (strong fundamentals) were persistently undervalued. In these subsets, the pricing errors were strongest. The authors also noted that while both the traditional value/glamour strategy (relying solely on BtM rankings) and the incongruent value/glamour strategy produce consistently positive annual returns, the frequency of positive returns was higher for the incongruent value/glamour strategy. It generated positive returns in 35 of 39 years over the sample period (versus 27 of 39 years for the traditional value/glamour strategy). They also found that annual returns to the incongruent value/glamour strategy were larger than the traditional value/glamour strategy in all but six years, with an average annual portfolio return of 20.8 percent versus 10.5 percent for the traditional value/glamour strategy.
Piotroski and So’s findings are supported by those of H.J. Turtle and Kainan Wang, authors of the study “The Value in Fundamental Accounting Information,” which appears in the Spring 2017 issue of the Journal of Financial Research. Using Piotroski’s F-Score, they examined the role of fundamental accounting information in shaping portfolio performance over the period from 1972 through 2012 and concluded that there was a behavioral-based explanation for the value premium.
Similar to Piotrowski and So, Crawford, Gray, Vogel and Xu sorted stocks on EM and 11 well-documented anomalies (and a combination score) which are proxies for the fundamental value of the stock:
- Net Stock Issues: Net stock issuance and stock returns are negatively correlated. It has been shown that smart company management issues
shares when sentiment-driven traders push prices to overvalued levels.
- Composite Equity Issues: Issuers underperform non-issuers with “composite equity issuance,” defined as the growth in a firm’s total market value of equity minus the stock’s rate of return. It’s computed by subtracting the 12-month cumulative stock return from the 12-month growth in equity market capitalization.
- Accruals: Firms with high accruals earn abnormally lower average returns than firms with low accruals.
- Net Operating Assets: The difference on a firm’s balance sheet between all operating assets and all operating liabilities, scaled by total assets, is a strong negative predictor of long-run stock returns.
- Asset Growth: Companies that grow their total assets more earn lower subsequent returns.
- Investment-to-Assets: Higher past corporate investment predicts abnormally lower future returns.
- Distress: Firms with high failure probabilities have lower subsequent returns.
- Momentum: High (low) recent past returns forecast high (low) future returns.
- Gross Profitability: More profitable firms have higher expected returns than less profitable firms.
- Return on Assets: More profitable firms have higher expected returns than less profitable firms.
- Ohlson O-Score: Stocks with a high risk of bankruptcy have lower returns than stocks with a low risk of bankruptcy.
Crawford, Gray, and Vogel then created two test portfolios. First, a “high mispricing” portfolio (where there is misalignment between valuations), which goes long value firms with high expectation errors (low EM, high fundamental value) and goes short glamour firms with high expectation errors (high EM, low fundamental value). Second, a “low mispricing” portfolio (where there is an alignment of valuation), which goes long value firms with low expectation errors (low EM, low fundamental value) and short glamour firms with low expectation errors (high EM, high fundamental value). Their empirical tests examined the spread between the two portfolios. The risk-based hypothesis predicts no difference between the returns of these portfolios, and the mispricing-based hypothesis predicts a positive spread in returns. The following is a summary of their findings:
- Portfolios with high investor expectation errors earn higher returns than portfolios with low investor expectation errors.
- Consistent with the hypothesis that the EM effect is likely explained by mispricing, in the low-mispricing portfolios, the reported four-factor (beta, size, value
and momentum) alpha estimates are not statistically different from zero, while the four-factor alpha estimates for the high-mispricing portfolios are positive and significant at the 5 percent level in every instance.
- Examining earnings announcement returns, forecast errors and forecast revisions, evidence supported the notion that the EM effect is driven, at least in part, by mispricing associated with predictable investor expectation errors. For example, the average announcement return for the value portfolio with high expectation errors (i.e., cheap, with high fundamental value) is 0.65 percent, which is larger than the -0.22 percent average announcement return for the glamour portfolio with high expectation errors (i.e., expensive, with low fundamental value). The difference in these two returns is the announcement return in the high-mispricing portfolio of 0.87 percent, which is significant at the 1 percent level. On the other hand, the returns to firms in the two portfolios with low expectation errors are similar.
- Returns to the high-mispricing EM strategy are significantly higher during periods of high investor sentiment relative to times of low investor sentiment. The same pattern doesn’t hold for the low-mispricing portfolio, providing further support to the mispricing-based hypothesis.
These results were robust to various tests, including exploring results against various time periods and asset pricing models. Thus, the authors concluded that there “is strong evidence in favor of the mispricing-based hypothesis and little evidence that the EM effect is a proxy for higher discount rates,” which would provide a risk-based explanation. The authors also examined the question: If the results are behavioral driven, hasn’t the market arbitraged away the anomaly? To address this question, they examined the limits to arbitrage associated with exploiting the EM portfolio strategy. The limits of arbitrage hypothesis predicts that the abnormal expected returns associated with the high-mispricing portfolio will be driven by the short leg of the portfolio, where arbitrage costs are highest. In support, they found that, on average,62 percent of the alpha, and more than 80 percent of the alpha associated with the best EM portfolio, is generated by the short leg of the portfolio. They note:
To the extent that managing short positions is costly, these results suggest that the mispricing associated with the high-mispricing EM portfolio is difficult to profitably exploit. In addition, if costly market frictions continue to exist and investor expectation errors persist, we can expect that the EM effect may continue in the future.
Crawford, Gray, and Vogel concluded:
The evidence supports the hypothesis that the excess returns associated with EM sorted portfolios is driven by mispricing and not increased systematic risk exposure.
Conclusion
What, if any, conclusions can we draw? Is the value premium risk-based or behavioral-based? The research provides support for both risk-based and behavioral-based explanations—the value premium may be compensation for risk or, it might be a free lunch (allowed to persist due to limits to arbitrage and the fact that human behavior has a strong tendency to persist). My own view is that it seems likely to be the result of a combination of a risk premium and behavioral errors—there’s an ex-ante premium, but it’s too large relative to the risks. In that case, we might consider it a free stop at the dessert tray!
About the Author: Larry Swedroe
—
Important Disclosures
For informational and educational purposes only and should not be construed as specific investment, accounting, legal, or tax advice. Certain information is deemed to be reliable, but its accuracy and completeness cannot be guaranteed. Third party information may become outdated or otherwise superseded without notice. Neither the Securities and Exchange Commission (SEC) nor any other federal or state agency has approved, determined the accuracy, or confirmed the adequacy of this article.
The views and opinions expressed herein are those of the author and do not necessarily reflect the views of Alpha Architect, its affiliates or its employees. Our full disclosures are available here. Definitions of common statistics used in our analysis are available here (towards the bottom).
Join thousands of other readers and subscribe to our blog.