We often hear that the market is 5% off its highs or that it is down 5% from the high of the year. This alone does not tell us much. The questions I want to answer are as follows: “How often does that 5% loss become a 10% loss? Or worse yet — a 20% loss?”
In other words, what are the historical distribution of outcomes, given a loss of x%?
I address this question in US markets and then extend the analysis to global markets and asset classes.
Here is the bottom line:
- Expect 5% sell-offs
- Expect 10% sell-offs
- When in a sell-off, monitor long-term trend rules (e.g., 200 day MA)
Please note that the analysis that follows may not be useful and/or predictive for the future. The research below is simply descriptive in nature and the intent is to give readers a better understanding of market history.
Data Details
First, everything I study is based on the closing price of the $SPX (S&P 500 Price Index). Any mention of high means the highest close.
The most obvious method of measuring the sell-off is based on the all-time high. But it can be a very long time between these highs, which means few occurrences to analyze and I am already worried about sample size.
A different way is to reset the high price to be the last closing price of the year. This new “reference high” becomes the high value we start the year with. If the market goes up, then each higher close than the previous “reference high” becomes our new reference high from which we can calculate our sell-off.
The advantage of this method is that we get to start every new year with a fresh new high and a sell-off of zero. I like this approach because we already naturally reset many of our metrics and benchmarks at the beginning of each year.
What do we measure?
Even with this definition of reference high, I was worried about having enough data. For this reason, I am using the S&P500 ($SPX) index back to 1929, which gives us 90 years of daily data. This is not total return data because I wanted to go as far back as possible. The data provider I used (GFD) recreated some indexes (for example $SPX) farther back than typically is available.
The Sell-Off
Now that we have defined our reference high, we can measure our sell-off based off that high. When the market has a 5% correction based on the close, we will count that as a sell-off. When does that sell-off end? When the $SPX closes back above the reference high close.
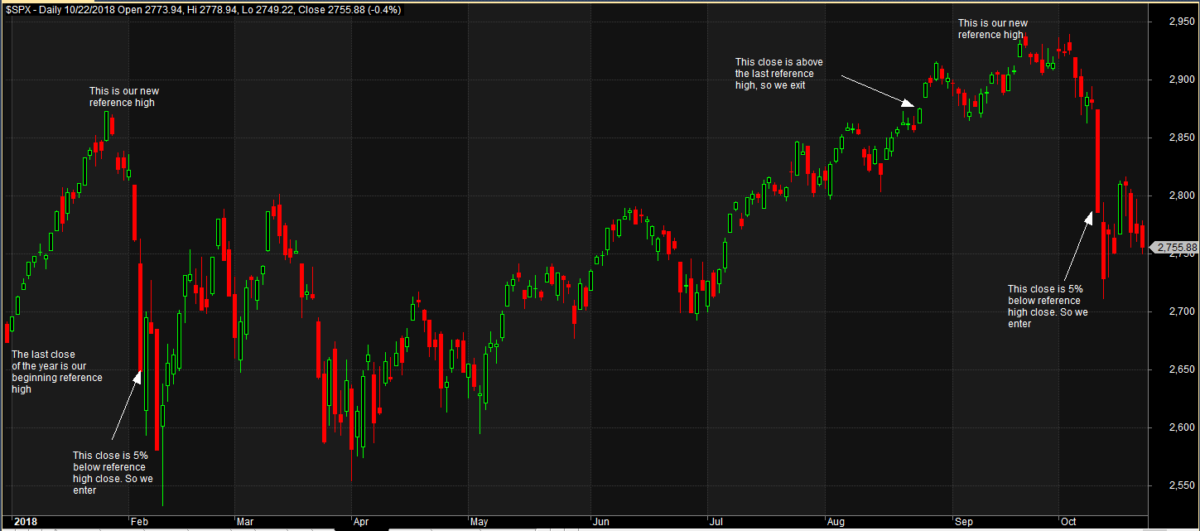
Think of these as trades where we enter on a close 5% or more below the reference high. Then we exit when the close is above the reference high. This allows us to measure how long it takes to make it back to the reference high. In a prolonged bear market that spans calendar years, there could be multiple trades open.
I allow multiple entries in the same year. This happened in 2018. The market had a 5% sell-off and entered on Feb 5, 2018. Then it closed above the reference high on August 24, 2018, which was the exit. Having made a new high, it then sold off again and entered on October 11, 2018. That trade stayed open until April 23, 2019. That last trade of the year is held until it closes above the reference high.
Here is the 2018 example:
The results are hypothetical results and are NOT an indicator of future results and do NOT represent returns that any investor actually attained. Indexes are unmanaged and do not reflect management or trading fees, and one cannot invest directly in an index.
Give me the numbers! 5% sell-offs
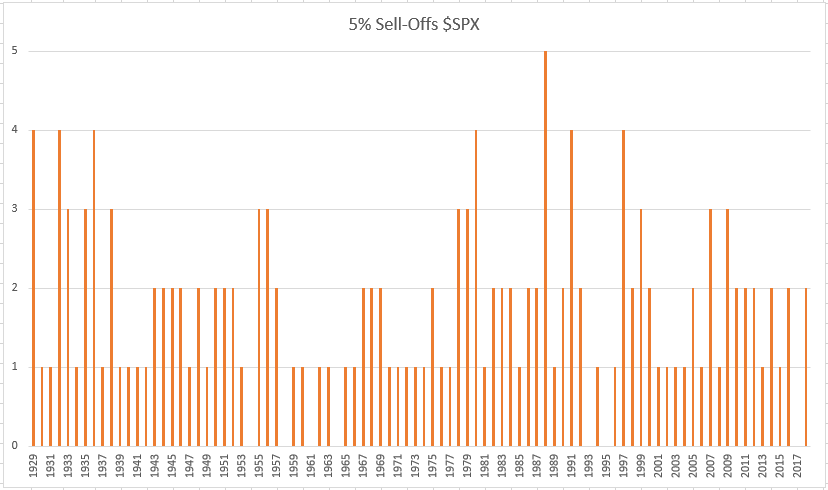
Here we have the count of sell-offs per year since 1929.
The results are hypothetical results and are NOT an indicator of future results and do NOT represent returns that any investor actually attained. Indexes are unmanaged and do not reflect management or trading fees, and one cannot invest directly in an index.
There have been 154 5% sell-offs since 1929. We can see it happens almost every year, with 92% of the years having at least one sell-off. And multiple 5% sell-offs are common. There has been an average of 1.7 5% sell-offs per year. So, when these happen, it is not something to worry about, yet.
5% becomes 10% or 20% or 30%
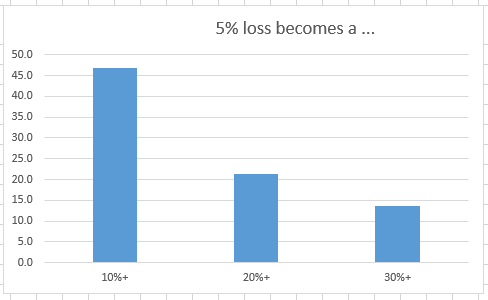
How often does that 5% sell-off become an even larger sell-off?
The results are hypothetical results and are NOT an indicator of future results and do NOT represent returns that any investor actually attained. Indexes are unmanaged and do not reflect management or trading fees, and one cannot invest directly in an index.
Those 5% sell-offs often become 10% sell-offs at 47% of the time. But only 21% of the time do they hit the dreaded 20% sell-off.
If the 5% sell-off does not become a 20% sell-off, it will reach the reference high, on average, in 80 trading days, or about 4 months, which is not that long.
1929-1999 vs 2000-2018
Are the sell-offs less frequent now? I will compare this century with the previous one. The 1900s averaged 1.7 5% sell-offs per year vs 1.6 for the more recent data. So, no change there.
Focusing again on those sell-offs that do not become 20%+. The average number of days to return to reference high for the 1900s is 79 trading days vs 68 trading days for this century. That is a 14% reduction, which is significant and highlights that markets have rebounded quicker in recent memory.
Below and Above the 200-day Moving Average
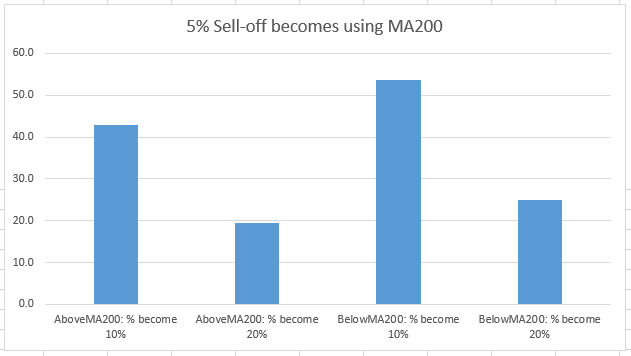
Is a 5% sell-off more likely to become a 20% sell-off when it occurs below the 200-day moving average (MA200)? My guess was yes. When a 5% sell-off closes below the MA200, 25% of the time it will continue to become a 20% sell-off. But above the MA200, that happens only 19% of the time. Not quite as often, but certainly not a definitive result.
The results are hypothetical results and are NOT an indicator of future results and do NOT represent returns that any investor actually attained. Indexes are unmanaged and do not reflect management or trading fees, and one cannot invest directly in an index.
What about 10% sell-offs?
The histogram below shows the count of 10% sell-offs per year since 1929.
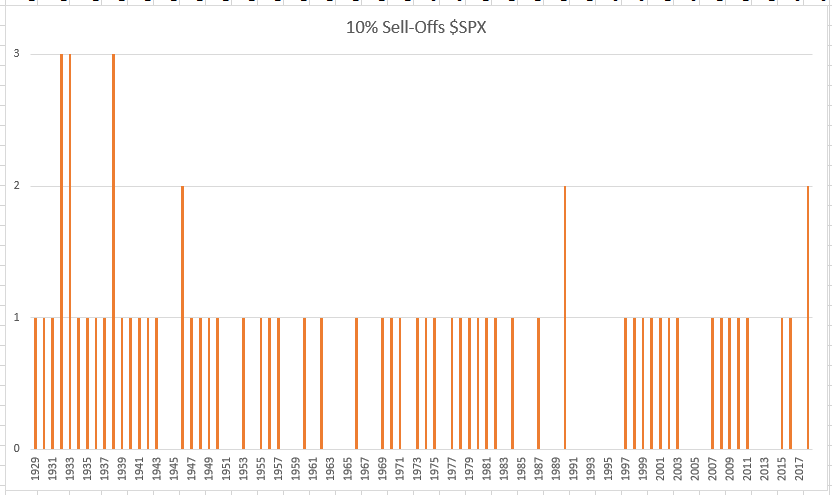
The results are hypothetical results and are NOT an indicator of future results and do NOT represent returns that any investor actually attained. Indexes are unmanaged and do not reflect management or trading fees, and one cannot invest directly in an index.
There have been 90 10% sell-offs since 1929. We can see it happens almost every other year at 63% of the years. Only six times has there been two-plus 10% sell-offs in one year, with last year being one occurrence.
10% becomes 20% or 30%
How often does that 10% sell-off become an even larger sell-off?
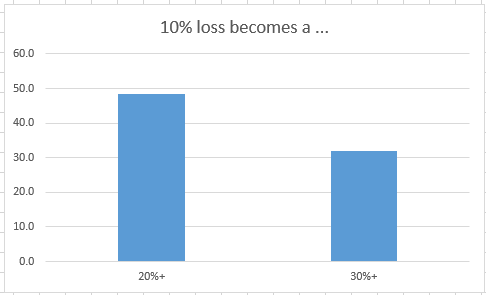
The results are hypothetical results and are NOT an indicator of future results and do NOT represent returns that any investor actually attained. Indexes are unmanaged and do not reflect management or trading fees, and one cannot invest directly in an index.
Those 10% sell-offs often become 20%+ sell-offs at 49% of the time.
If the 10% sell-off does not become a 20% sell-off, it will reach the reference high on average in 113 trading days.
1929-1999 vs 2000-2018
Are the sell-offs less frequent now? The 1900s averaged .74 per year vs .68 for this century. Slight decrease.
Focusing again on those sell-offs that do not become 20%+. The average number of days to return to reference high for the 1900s is 112 trading days vs 115 trading days for this century.
No change. Which is interesting since the 5% ones were faster.
Below and Above the 200-day Moving Average
Does the MA200 make further sell-offs more likely starting with a 10% sell-off. Above the MA200, a 10% sell-off became a 20%+ sell-off 38% of the time but the last time that happened was in 1938.
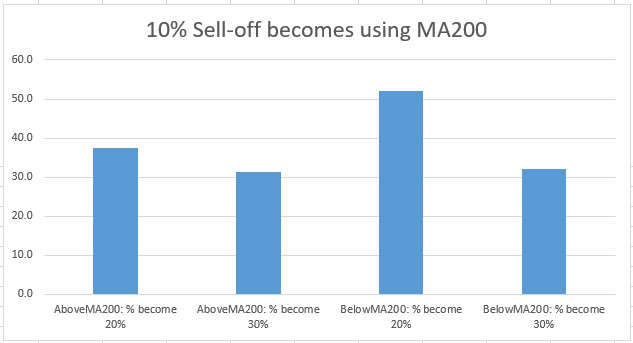
The results are hypothetical results and are NOT an indicator of future results and do NOT represent returns that any investor actually attained. Indexes are unmanaged and do not reflect management or trading fees, and one cannot invest directly in an index.
How About Other Markets?
How does this analysis look like in other markets? What follows is a list of other markets tested and the start year of the data. The start date was determined by when daily data started and I had 200 days of data.
- Australia ASX All-Ordinaries: 1986
- DOW JONES US Real Estate Index: 1993
- Dow Jones Composite Average: 1935
- UK FTSE 100 Index: 1985
- COMEX Gold Futures Prices: 1981
- Hong Kong Hang Seng Composite Index: 1971
- MSCI EAFE Price Index: 1983
- MSCI Emerging Market Price Index: 1989
- Nasdaq 100 Index: 1986
- S&P 500 Composite Price Index: 1929
- MSCI World Price Index: 1977
- Japan Nikkei 500 Index: 1985
All Markets: % Sell-Offs Average per Year
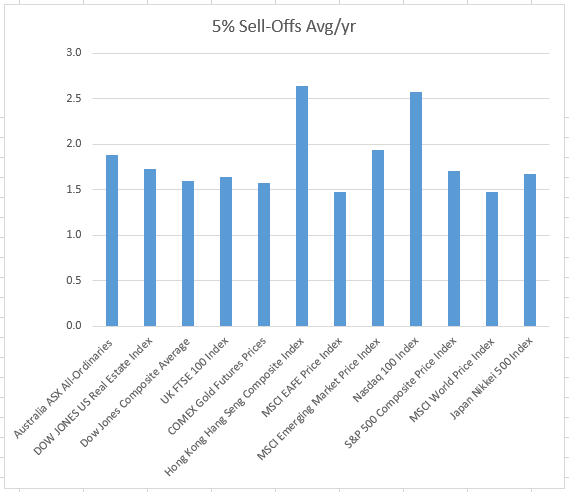
The results are hypothetical results and are NOT an indicator of future results and do NOT represent returns that any investor actually attained. Indexes are unmanaged and do not reflect management or trading fees, and one cannot invest directly in an index.
In all the markets 5% sell-offs are a yearly event. But expect multiple 5% sell-offs for the ASX, Hang Seng, Emerging Markets and Nasdaq indexes.
All Markets: % Years with 10% Sell-Offs
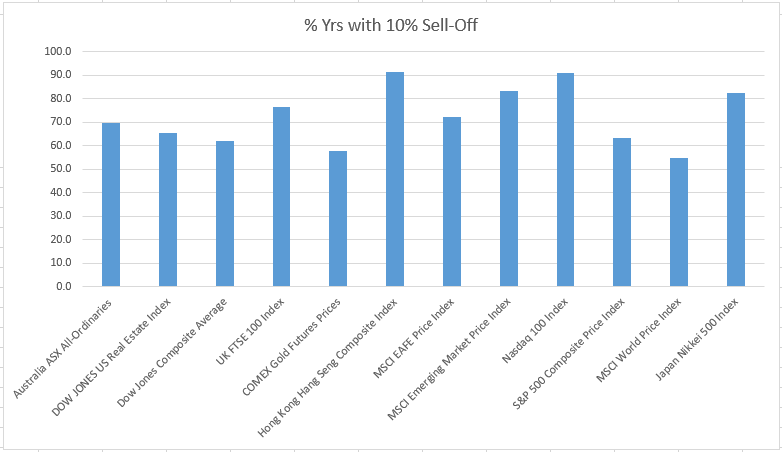
The results are hypothetical results and are NOT an indicator of future results and do NOT represent returns that any investor actually attained. Indexes are unmanaged and do not reflect management or trading fees, and one cannot invest directly in an index.
We can see that 10% sell-offs are very common in other markets. In particular the Hang Seng Index and the Nasdaq. I did not realize they happened that often in the Nasdaq at 91%. I did expect Gold to be more volatile but it was one of the least volatile.
All Markets: Percent of 5% sell-off that become 20%

The results are hypothetical results and are NOT an indicator of future results and do NOT represent returns that any investor actually attained. Indexes are unmanaged and do not reflect management or trading fees, and one cannot invest directly in an index.
The differences in the markets shows up in the large range in this chart. Even though the Nasdaq has frequent sell-offs, they rarely become 20%+ sell-offs. On the other-hand, the Nikkei, for example, is a different animal.
All Markets: % of 10% sell-off that become 20%
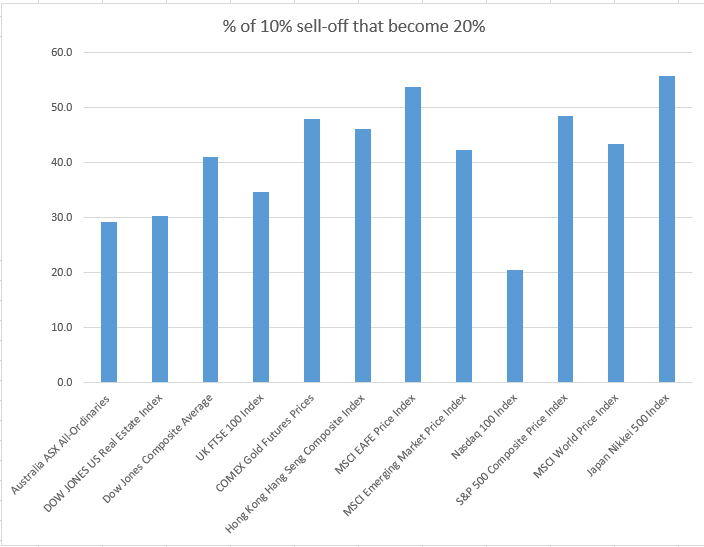
The results are hypothetical results and are NOT an indicator of future results and do NOT represent returns that any investor actually attained. Indexes are unmanaged and do not reflect management or trading fees, and one cannot invest directly in an index.
Once we hit 10%, there is an over 40% chance that a lot of the indexes will continue on to a 20%+ sell-off. Again, it is surprising how low the Nasdaq number is at 20%. I doubled checked the numbers and they were correct. Since the data is from 1986 and there have been only two bear markets since then, I believe this explains the result.
Final Thoughts
What have I learned from the slicing and dicing of the data of SPX, which I trade?
- Not to worry about a 5% sell-off because they are a frequent occurrence. Being above the 200-day gives an added measure of comfort.
- Expect 10% sell-offs
- If a market enters a 10% sell-off, one may want to look closely at the market, especially if under the 200-day MA
About the Author: Cesar Alvarez
—
Important Disclosures
For informational and educational purposes only and should not be construed as specific investment, accounting, legal, or tax advice. Certain information is deemed to be reliable, but its accuracy and completeness cannot be guaranteed. Third party information may become outdated or otherwise superseded without notice. Neither the Securities and Exchange Commission (SEC) nor any other federal or state agency has approved, determined the accuracy, or confirmed the adequacy of this article.
The views and opinions expressed herein are those of the author and do not necessarily reflect the views of Alpha Architect, its affiliates or its employees. Our full disclosures are available here. Definitions of common statistics used in our analysis are available here (towards the bottom).
Join thousands of other readers and subscribe to our blog.
