A large body of evidence demonstrates that investment strategies focused on buying stocks that are cheap relative to measures of fundamental value have achieved higher long-term returns than the broad market. Motivated by such legendary investors as Benjamin Graham, David Dodd, and Walter Schloss, deep value investors look to build portfolios of stocks with the cheapest valuations relative to their intrinsic value.
Deepika Sharma, Muling Si, and Josephine Smith contribute to the literature on the performance of value strategies with their study “Focused Value,” which appeared in the Fall 2019 issue of The Journal of Index Investing. They began by noting:
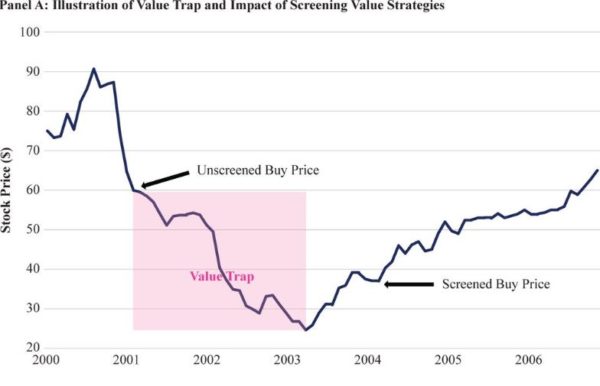
One of the key risks of deep value investing is the value trap. A value trap stock appears undervalued but has exhibited a sharp decrease in its market price for reasons that are not evident through valuation multiples—perhaps the company has weak financials, a failing business model, or poor management. Without the dry powder and fortitude to hold onto these positions for possibly an extended period of time, these investors will sell at a loss.
With the risks of value traps in mind, Sharma, Si, and Smith sought to find a methodology that would minimize the risks of investing in value traps while still allowing them to exploit the value premium. In building their strategy, they first reviewed the empirical research findings on various value metrics. Based on the historical evidence, they chose four metrics to build their portfolio: price-to-book, price-to-dividend, price-to-cash flow, and price-to-earnings.
The data and prior research they cited show that:
“…the dispersion in performance of the various value metrics implies that a composite of value measures results in a more stable portfolio, as individual metrics may have accounting errors or include random noise.” Deepika Sharma, Muling Si and Josephine SmithThe Journal of Index Investing Fall 2019, 10 (2) 63-79
Based on historical performance, and the fact that it’s less susceptible to manipulation, they gave the most weight to price-to-cash flow and the least weight to price-to-book and price-to-earnings.
To minimize the risk of value traps, they introduced a small number (to reduce the risk of overfitting the data) of screens. Based on the empirical research, they removed stocks that were ranked in the top 10 percent in risk (defined as the one-year trailing realized volatility of daily total returns) or the top 10 percent in leverage (the ratio of total debt to total assets). Note that past volatility predicts future volatility, and volatility is negatively related to returns. And the research has found that one of the great anomalies in finance is that stocks with a high risk of bankruptcy (as measured by the Ohlson O-Score) have lower returns than stocks with a low risk of bankruptcy. Further, they added a fundamental sentiment screen, which removed stocks that had sentiment moving in the negative direction (there were more analysts’ downgrades in earnings estimates than upgrades).
The use of these screens led to increased concentration, higher turnover, and higher transaction costs. To minimize these effects, they rebalanced only when the composite value score of the portfolio fell 20 percent below the optimal level. They also rebalanced whenever the number of stocks in the portfolio fell below 40, their target level. This reduces costs while allowing the portfolio to maintain its deep value exposure. Portfolios were equal-weighted.
Following is a summary of their findings, covering the period January 2000 through August 2018:
- The focused value simulation outperformed the underlying benchmark, the Russell 1000 Index, by 6.6 percent a year and the value benchmark, the Russell 1000 Value Index, by 5.9 percent on an annualized basis.
- The risk-adjusted performance of the focused value simulation in excess of cash, as represented by the Sharpe ratio, was 0.78, over twice the Sharpe ratio of the Russell 1000 Index and 1.8 times the Sharpe ratio of the Russell 1000 Value Index.
- The unscreened focused value simulation exhibited similar average returns with substantially higher annualized volatility (25.8 percent versus 15.6 percent for the screened simulation), leading to a lower Sharpe ratio of 0.53.
- Given the more concentrated portfolio, the focused value strategy ran a higher tracking error of 9.2 percent to the Russell 1000 Index than did the Russell 1000 Value Index at 5.1 percent.
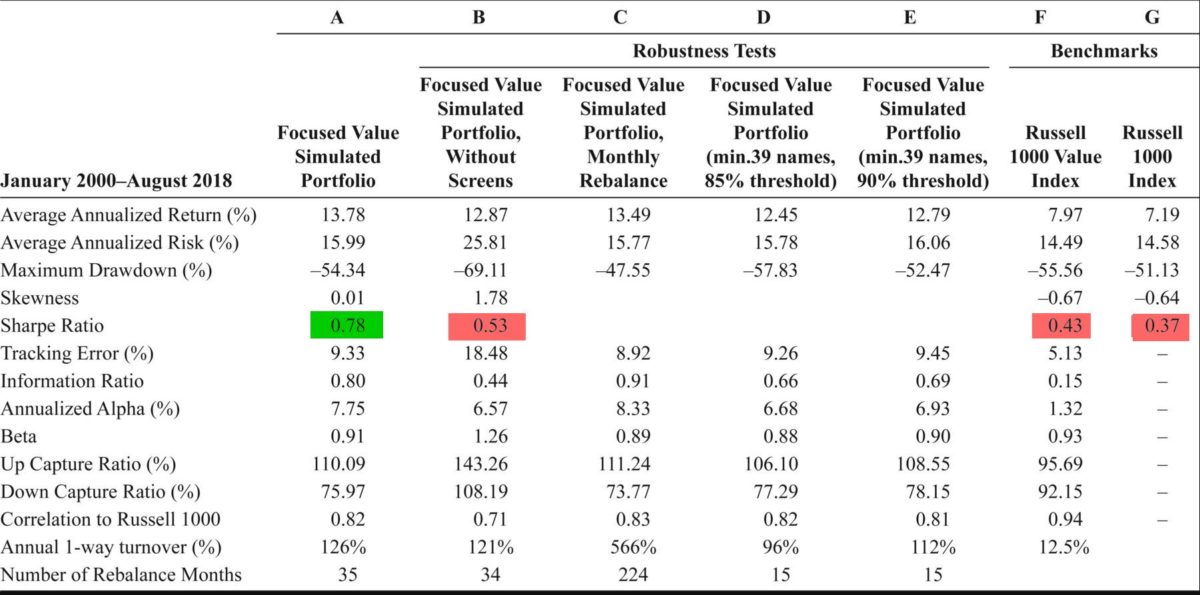
Source: Deepika Sharma, Muling Si and Josephine SmithThe Journal of Index Investing Fall 2019, 10 (2) 63-79 The results are hypothetical results and are NOT an indicator of future results and do NOT represent returns that any investor actually attained. Indexes are unmanaged, do not reflect management or trading fees, and one cannot invest directly in an index.
As tests of robustness, they ran iterations with slightly different parameters of the conditional rebalances. The two parameters included the number of stocks held and the threshold for how much the current portfolio’s value score could drift below the optimal portfolio at the time of rebalance review. They found that the choice of parameter didn’t significantly impact portfolio results.
Sharma, Si, and Smith concluded:
The simulated data illustrates a long-only systematic focused value strategy constructed using large and mid-cap stocks to mitigate potential value trap risks, seek high-value exposure and stay invested in value names until portfolio and market valuations warrant rebalance. The simulated results demonstrated increased risk-adjusted returns with superior downside capture, significant alpha over the broad market, and high active share exhibited by potential large sector exposures.
Their findings are consistent with prior research. For example, the use of multiple value metrics, composite scores, and negative screens is now common among many quantitative fund providers.(1) The bottom line is that these findings demonstrate that the performance of simple value indexes can be improved upon, at the margin, by applying the findings from peer-reviewed research.
References[+]
| ↑1 | See here for an example with the Quantitative Value process. |
|---|
About the Author: Larry Swedroe
—
Important Disclosures
For informational and educational purposes only and should not be construed as specific investment, accounting, legal, or tax advice. Certain information is deemed to be reliable, but its accuracy and completeness cannot be guaranteed. Third party information may become outdated or otherwise superseded without notice. Neither the Securities and Exchange Commission (SEC) nor any other federal or state agency has approved, determined the accuracy, or confirmed the adequacy of this article.
The views and opinions expressed herein are those of the author and do not necessarily reflect the views of Alpha Architect, its affiliates or its employees. Our full disclosures are available here. Definitions of common statistics used in our analysis are available here (towards the bottom).
Join thousands of other readers and subscribe to our blog.