- Authors: Ying Xiao and Glen C. Arnold
- A version of this paper can be found here
- Want to read our summaries of academic finance papers? Check out our Academic Research Insight category
Introduction
This is our third post in our series on “net-nets” having previously analyzed “Benjamin Graham’s Net Current Asset Values: A Performance Update” by Henry R. Oppenheimer and “Graham’s Net-Nets: Outdated or Outstanding?” by James Montier.
The focus of this post is the research paper “Testing Benjamin Graham’s Net Current Asset Value Strategy in London” which was originally summarized by Wes here. The objective of the paper was to examine the performance of securities that were trading at greater than 1.5 of Net Current Asset Value (NCAV)/Market Value (MV) (i.e. less than 2/3 of NCAV) during the 26 year period from 1980 to 2005 on the London Stock Exchange. In addition, the authors sought to examine whether the “excess returns” of such stocks could be explained by “risk”, the size effect, the Capital Asset Pricing Model (CAPM), the Fama-French three Factor Model (FF3M) or investor irrationality.
Our objective was to analyze the study itself; determine its reliability, draw our own conclusions and glean, if any, actionable advice for the practitioner of the “net net” method of investing.
Key Methodology
- Valuation metric:
The authors stipulate how Benjamin Graham quantified NCAV per share:
“Graham’s NCAV/MV strategy calls for the purchase of stocks at a price 2/3 or less of the NCAV. Per share NCAV, as defined by Graham (Graham and Dodd (1934), Graham (1976)), is the balance sheet current assets minus all the firm’s (current and long-term) liabilities divided by the number of shares outstanding.”
However, it was not obvious to us that the authors replicated the abovementioned formula exactly. They mention the following:
“In order to calculate NCAV, current assets, current liabilities, long-term debt and preferred stock are downloaded from balance sheet entries on Datastream.”
From the above we deduce that the authors calculated the NCAV per share as follows:
Net Current Asset Value per share = (Current Assets – (Current Liabilities + Long Term Debt + Preferred Shares))/Common Shares Outstanding
The difference between Graham’s formula and that implied by the data used in the study being the use of “long-term debt” as a proxy for all long-term liabilities.
Lastly, “Only those stocks with NCAV/MV higher than 1.5 are included in the NCAV/MV portfolios.” (i.e. less than 2/3 of NCAV).
- Weighting: “weighted equally” and “value-weighted”
- Purchase/rebalance date: “Portfolios of stocks are formed annually in July.”
- Holding/rebalancing period: “Buy-and-hold portfolios held for one, two, three, four or five years are constructed”
Reliability
While there are numerous biases/errors that can be made when conducting studies, below we have analyzed those we deem most likely to impact a study of this nature:
1. Survivorship bias
“We include companies that have been de-listed from the exchange due to merger, liquidation or any other reason in the holding period, thus avoiding survivorship bias.”
Based on the above the data source appears to be free from survivorship bias.
2. Look Ahead bias
“Portfolios of stocks are formed annually in July. To be included in the sample for year t, firms must have data for NCAV in December of t-1, and at least one return observation in the post-formation period. The six-month lag between the measurement of NCAV and return data allows for the delay in publication of individual companies’ accounts, thus ensuring that the financial statements are public information before the returns are recorded.”
Given the “six-month lag” the study appears to be free from look-ahead bias.
3. Time period bias
The study spans 26 years and we classify this as a “more reliable” period.(1)
4. Data source and treatment
“The research period is from January 1980 to December 2005 (company data prior to 1980 is unreliable and incomplete Nagel (2001)). Two databases are used: monthly return data and general information is from the London Share Price Database (LSPD), and; annual accounting data is from Datastream…Because of potential problems defining accounting variables and equity capitalisation, we exclude companies with more than one class of ordinary share and foreign companies. Also excluded are companies on the lightly regulated markets and companies belong to the financial sector…Returns for each company, including dividends, are adjusted for changes in stock splits, rights issues and stock repurchases.”
While we do not have any specific knowledge as to the reliability of the data sets used, from the above extract it is clear the researchers took specific measures to ensure their data was reliable and that the companies, markets, and sectors examined were also appropriate.
5. Human error
There is nothing specified in the research methodology that would make us believe this study is at greater risk of suffering from human error.
6. Journal rating/credibility (2)
While academically rigorous, this study was not, to our knowledge, published in a top tier academic journal and therefore cannot be granted the “additional credibility” that may come with such publication.
Reliability Assessment: Based on the above the study appears to be reliable.
Returns and Analysis
Table 2 is reproduced below:
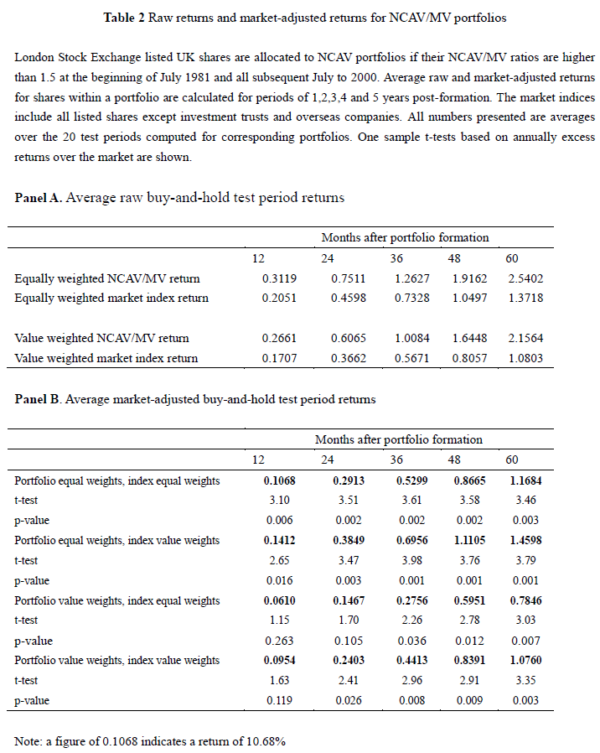
“We find that Graham’s NCAV/MV stocks substantially outperform the stock market over holding periods of up to five years. The average 60-month buy-and-hold raw return is 254 percent with equal weighting within the NCAV/MV portfolio and 216 percent with value weighting, which are much higher than market indices of only 137 percent and 108 percent. One million pounds invested in a series of NCAV/MV (equal weighted) portfolios starting on 1st July 1981 would have increased to £432 million by June 2005 based on the typical NCAV/MV returns over the study period. By comparison £1,000,000 invested in the entire UK main market would have increased to £34 million by end of June 2005.
For almost all post-formation lengths, and regardless of within portfolio weighting, the NCAV/MV portfolio outperforms either equal weighted or value weighted market indices with high statistical significance. Market-adjusted returns rise to 117 percent and 146 percent after five years if the stocks are equally weighted; and 78 percent and 108 percent after five years if the stocks are value weighted. Inspection of table 2 clearly shows that there are substantial benefits from selecting high NCAV/MV stocks.”
Let the analysis begin!
What exactly are “Average raw returns” and are these returns truly reflective of a practitioner’s reality? “Raw returns” appear to be returns that are not adjusted for “risk” or the returns offered by the general market i.e. “market-adjusted returns”. Furthermore, the “Average raw returns” are calculated as the arithmetic mean(3) of returns; consequently, the reported returns would have overstated the actual returns achieved by an investor as measured by the geometric mean (i.e. compound annual growth rate (CAGR)). We examined in detail the potential impact of the arithmetic vs geometric mean when measuring investment returns in “An Analysis of Graham’s Net-Nets: Outdated or Outstanding”.
Moreover, the authors state,
“One million pounds invested in a series of NCAV/MV (equal weighted) portfolios starting on 1st July 1981 would have increased to £432 million by June 2005 based on the typical NCAV/MV returns over the study period.”
The implausibility that the strategy could have absorbed capital of such magnitude and achieved the reported rate of return is illuminated in our examination of the investment universe which follows.
The authors did not mandate a minimum market capitalization requirement for the securities they examined and consequently they included even the very smallest firms in the market.
They state:
“…stocks are allocated to an NCAV/MV portfolio if their ratio is higher than 1.5. The numbers shown are the percentage of the average NCAV/MV portfolio falling into each size decile.… nearly 79 percent number of companies are very small (belong to size 1 and size 2)”.
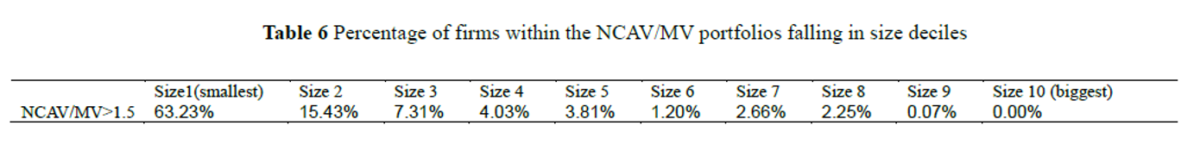
The smallest decile of the market is where 63.23% of the investment candidates were identified and it is in this decile where the greatest trading constraints are likely to be faced. From table 2 we note that “value weighting” the NCAV/MV portfolio resulted in a 4.58% (31.19% – 26.61%) reduction in the “average raw buy-and-hold” return for portfolios held for 12 months implying that the smallest stocks disproportionately contributed to the reported outperformance.
In light of the above it is highly likely that the results were biased by the inclusion of the very smallest firms as even when investing relatively modest sums, the securities of such firms are virtually untradeable.
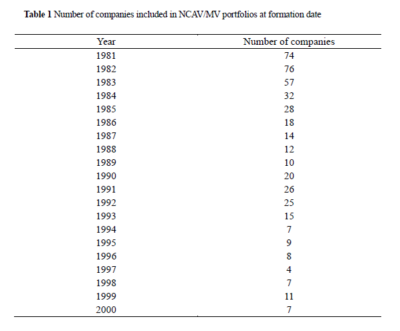
Number of Companies
Table 1 is reproduced below:
The results are hypothetical results and are NOT an indicator of future results and do NOT represent returns that any investor actually attained. Indexes are unmanaged and do not reflect management or trading fees, and one cannot invest directly in an index
While the number of companies meeting the NCAV/MV > 1.5 criteria was relatively large at the commencement of the study period, by 1994 only a few companies met the necessary criteria with 1997 providing just four candidates suitable for investment. As returns were not reported for each individual year we cannot be certain of the impact on the overall returns for the years with relatively few investment candidates. This is significant given that relatively few net-net investors would concentrate their portfolio in less than 10 positions. Therefore, a practitioner may wish to assume that a portion of their hypothetical portfolio was invested in cash (or cash-like instruments) in years where there was a relative dearth of net-nets thereby foregoing the potential returns (or avoiding a drawdown).
Furthermore, while one may be tempted to use the reported arithmetic mean returns as a guidepost to estimate the more meaningful geometric mean, we would caution against such an endeavor due to the following:
- Psychologically, this may be the type of thinking that is driven, in part, by confirmation bias (“net-nets outperform!”) and sunk cost fallacy (i.e. having put in the time and effort to read a study one may want to walk away “knowing something definitive”).
- Mathematically, as demonstrated in our analysis of “Graham’s Net-Nets: Outdated or Outstanding?” the arithmetic and geometric mean can diverge materially.
- Statistically, as the number of holdings in a portfolio falls the volatility of that portfolio may increase thereby leading to a greater potential divergence between the geometric and arithmetic mean. How portfolio volatility changes with the number of holdings in a portfolio was examined, for example, by Elton and Gruber in “Risk Reduction and Portfolio Size: An Analytical Solution”(4) and by Alpha Architect here and here.
So, psychologically, mathematically, and statistically attempting to estimate the geometric mean is precarious and more speculative than it may initially appear.
“The first principle is that you must not fool yourself and you are the easiest person to fool.” – Richard P. Feynman
Explanations of the Excess Returns
The study also sought to examine the “excess returns” of the net-net strategy relative to the “UK main market” from a number of perspectives.
A summary of the findings are as follows:
- Consistency – when equal weighting the NCAV/MV portfolio and value or equal weighting the market index the NCAV/MV strategy beats the market in 16 out of 20 years. Therefore, the authors conclude that “the strategy is fairly, but not completely, reliable.”
- Deletions and liquidations – interestingly, “2.6 percent of the NCAV portfolio on average failed (deleted due to liquidation) compared with 4.2 percent of the companies in the market index. This evidence does not support a risk-based explanation for the out-performance of NCAV/MV stocks, based on distress (Fama and French (1996) refer to financial distress risk).”
- Beta and standard deviation – “The test for CAPM-beta risk does not provide support for the view that the NCAV/MV strategy is fundamentally riskier… standard deviations of monthly returns for NCAV/MV portfolios are slightly higher than the market, but we need to consider the fact that these portfolios contain a small number of companies and so would be expected to exhibit greater volatility.”
- Size effect – “even after allowing for size effects in returns, there is an average NCAV/MV premium of 11.3 percent per annum for five years holding. The size effect does not fully explain the abnormal return of the NCAV strategy.” It should be noted that while the authors state “One million pounds invested in a series of NCAV/MV (equal-weighted) portfolios starting on 1st July 1981 would have increased to £432 million by June 2005 based on the typical NCAV/MV returns over the study period”, given “nearly 79 percent number of companies are very small (belong to size 1 and size 2)” (refer Table 6) it is highly improbable the strategy could have absorbed capital of such magnitude and achieved the reported rate of return.
- Fama and French’s three-factor model – “SMB, HML, and the market premium do not capture the variation in NCAV stock returns.”
Given the inability of that specified above to explain the excess returns, it left the authors to suggest that “premiums might be due to irrational pricing”.
Conclusions and Practical Implementation
The study, “Testing Benjamin Graham’s Net Current Asset Value Strategy in London” appeared to be one the most reliable and rigorous studies published on net nets. Not only did the study examine the return of net nets over various holding periods, it was also the first such study to focus on the UK market, thereby creating something of an “out-of-sample” test.
Unfortunately, the “average raw returns” reported in the study were calculated as the arithmetic mean of returns; consequently, the reported returns would have overstated the actual returns achieved by an investor as measured by the more appropriate geometric mean (i.e. CAGR). Without specification of the geometric mean return (i.e. CAGR) we cannot be certain of the actual return achieved. In addition, the authors did not mandate a minimum market capitalization requirement for the firms they examined, consequently they included the very smallest firms in the market. The inclusion of the very smallest firms is highly likely to have biased the results as even when investing relatively modest sums, the securities of such firms are virtually untradeable.
While it is disappointing to not be able come away with a “definitive conclusion” with regard to the actual returns achieved, what we have uncovered may also be valuable; there appears to be a gap between what can be accepted in academia as an appropriate way to measure returns vs what is “truly reliable” and actually attainable from the viewpoint of the practitioner.
References[+]
| ↑1 | For reference:
< 10 years; inadequate/unreliable 11 to 20 years; somewhat reliable > 20 years; more reliable > 40 years; most reliable |
|---|---|
| ↑2 | https://alphaarchitect.com/2015/04/01/where-to-find-cool-academic-finance-research/ |
| ↑3 | We were able to get in contact with the author, Glen Arnold, PhD and he confirmed that “Each post-portfolio formation month has a number ,1, 2, 3 etc. The returns are measured for the post-portfolio month e.g. month 35, for each of the portfolios starting in different years. They are then simply averaged arithmetically.” |
| ↑4 | Elton, E. and Martin Gruber, 1977, Risk Reduction and Portfolio Size: An Analytical Solution, The Journal of Business 50, p 415-437. |
About the Author: Gaurang Merani, CPA
—
Important Disclosures
For informational and educational purposes only and should not be construed as specific investment, accounting, legal, or tax advice. Certain information is deemed to be reliable, but its accuracy and completeness cannot be guaranteed. Third party information may become outdated or otherwise superseded without notice. Neither the Securities and Exchange Commission (SEC) nor any other federal or state agency has approved, determined the accuracy, or confirmed the adequacy of this article.
The views and opinions expressed herein are those of the author and do not necessarily reflect the views of Alpha Architect, its affiliates or its employees. Our full disclosures are available here. Definitions of common statistics used in our analysis are available here (towards the bottom).
Join thousands of other readers and subscribe to our blog.