1. Introduction
In an influential piece, Sharpe (1991)(1) put forward the proposition that active investing must be a losing pursuit in the aggregate, as it amounts to a zero-sum game in gross terms and hence must be a negative-sum game after costs. I take a critical look at the underlying concepts and assumptions behind Sharpe’s proposition and link it to the issue of whether it is worthwhile for investors to consider using active fund managers. I highlight some of the related academic research along the way. This paper has been written for investment industry practitioners and is mainly a synthesis of existing ideas.
The broad thrust of this paper is that Sharpe’s proposition is not water-tight upon closer examination, and certainly should not be received as gospel. In particular, it should not be taken as sufficient to support the general conclusion that indexed funds should necessarily be favored over active managers. Rather, the evidence indicates that whether active or passive management is likely to deliver a better outcome will vary with the circumstances of the investor and the asset category being considered. It is wrong to make any sweeping generalizations. ‘It depends’ is the main message.
Before continuing, let me put some views on the table. Personally, I am neither for nor against either active or passive management, but rather see both options as worth considering. Fortunately, in some quarters the choice between active and passive no longer seems viewed as a ubiquitous either/or decision, which I wholeheartedly endorse. In other quarters, the mantra that ‘active management adds no value’ seems to have been embraced and is helping to fuel a switch to passive which may not be in the best interests of all investors. Further, the active versus passive debate is still often presented in adversarial terms. It would be much better framed around identifying situations where one approach might be preferred, or both should be used in tandem. To this effect, section 9 presents a framework that may assist to identify situations where active managers may form part of the mix. Hopefully, this paper may help spur more fruitful discussion and some deeper thought.
A PDF version of this is available here.
2. Sharpe’s Proposition
Sharpe’s logic is seductive. He calls his paper “the arithmetic of active management”, and presents a case that active investing must be a negative-sum game as an inconvertible mathematical truism. His argument is that, as all investors hold the market in aggregate, then active investing must fail on average as a matter of an adding-up constraint. Passive investors who hold the market will earn the gross market return pre-costs. The remainder are active investors who each deviate from market weights in some way, but in aggregate must also hold the market for the holdings to add up. Thus active investors also get the gross market return in the aggregate, with anyone active investor’s gain being another active investor’s loss. This also means active investors must, therefore, do worse than passive investors in net returns as they are incurring greater costs in terms of fees and trading. Active investing is thus a zero-sum game in gross terms and a negative-sum game in net terms. QED.
French (2008)(2) backed up Sharpe in his Presidential Address to the American Finance Association. He presented an estimate of 67 basis points as the aggregate cost that investors incurred in pursuing active returns in US equities over the period 1980-2006. His estimate incorporates all fees and expenses in mutual funds, hedge fund fees, the investment management costs of institutional investors, and an estimate of trading costs; and deducts the estimated cost of investing passively. The implication is that this is a big cost to pay in the hope of outperforming the market.
French acknowledges that active investment may provide a social benefit by making the market more efficient. Even so, active investors are paying the price for this social benefit without reaping any private gain. French estimates that the total cost incurred of providing this ‘service’ amounts to about 10% of the total market capitalization. While greater market efficiency may raise returns for all investors, he argues that active management remains a negative-sum game nevertheless. Essentially passive investors are free-riders on any positive externalities generated by active managers through their efforts to outperform.
The implications of Sharpe’s proposition are worth pointing out as background for interpreting the evidence from academic research. A key test of Sharpe’s proposition that active investing amounts to a zero-sum game at the gross return level and a negative-sum game at the net return level is whether the aggregate (i.e. asset-weighted) return earned by active investors relative to the market is zero before costs. If this were found to be the case, then it naturally follows that the net active return will be negative. As we will see, there is a fair amount of dissonance between this condition and the way that most academic research is conducted. In particular, it is difficult to observe the returns earned by all active investors. Further, Sharpe’s proposition does not imply that active managers cannot outperform, but rather that other active investors must underperform for them to do so. This nuance leaves open the door for active managers to outperform where they possess some competitive advantage over other active investors: a matter that will be addressed later.
3. Grossman and Stiglitz offer a different perspective
Sharpe’s proposition grates against an alternative perspective that was put forward earlier by Grossman and Stiglitz (1980) (3). Grossman and Stiglitz (GS) describe an equilibrium where those that invest in ‘information’ receive higher gross returns on average, but these returns are just enough to cover the costs of seeking out the information. Meanwhile, those who do not invest in information get lower gross returns. However, the net expected return is the same for both groups on average. The implication is that a GS equilibrium would see active investors generating higher gross returns than passive investors, but only just enough to offset the difference in costs. In these research pieces, we have two Nobel Prize laureates pitched against each other
GS’s perspective makes sense as a plausible equilibrium. It presents a rational explanation for why active management can cohabitate with passive investing. Indeed, the GS view effectively implies that Sharpe’s proposition does not accord with a rational equilibrium, as one would need to assume that active investors are irrational to explain the existence of active management. That is, active investors are either fools, or their decision-making is impaired by behavioral effects. This is possible, and perhaps the current strong growth in passive investing is a sign of people waking up to the error. However, relying on pervasive and persistent irrationality to explain the broad and extended use of active managers over many years seems a longbow. Mass delusion on this scale seems unlikely. Could people really be THAT stupid?
Another argument for why equilibrium might look like that proposed by GS arises by considering the plausibility of the two extremes of either 100% active or 100% passive investing. Either extreme is likely to be unstable. A 100% active approach would amount to a costly competitive game over active returns. The losers of the game – those with limited ‘skill’ – would have the incentive to give up paying to play and go passive. On the other hand, 100% passive investing would likely produce significant mispricings, given that no one would be focusing on whether prices are right. This should encourage some investors to go active, attracted by the existence of opportunities to exploit. The equilibrium mix between active and passive should sit in between these two extremes. It will probably be similar to the equilibrium described by GS, with active investors receiving some compensation for their cost and effort. The markets may currently be working towards such an equilibrium, having started from a 100% active approach some decades ago.
For the above reasons, I am personally attracted to the GS perspective, whereas my reaction to Sharpe’s proposition is one of suspicion. Let’s look at some of the evidence.
4. Berk and van Binsbergen show how to do the sums, and Leippold and Rueegg follow up
While total returns for ALL active investors are hard to observe, evidence exists on aggregated fund returns. I am going to start with the work of Berk and van Binsbergen (2015, 2016)(4), rather than the more traditional investigations into active returns earned by the ‘typical’ manager. Berk and van Binsbergen (BvB) separate out the question of whether active managers add value from the question of what net active returns are received by investors. They argue that the net returns earned by investors reflect how the market clears for fund management services, i.e. who extracts the value-add associated with any skill (or, from the GS perspective, the return from investing in information). Recall that under Sharpe’s proposition, active investors as a group should generate zero gross active returns but deliver negative net returns. Under GS’s equilibrium, one would expect to see positive gross returns and net returns of around zero. What BvB find for US equity mutual funds appears much closer to a GS equilibrium than Sharpe’s proposition.
BvB estimates that the gross value-add versus the index over the period 1977 to 2011 is positive in dollar terms, averaging about $3.2 million per year per fund. This seems inconsistent with Sharpe’s proposition, which tags active management as a zero-sum game in gross terms. However, it does not necessarily imply that the zero-sum game notion is wrong. It could be that active US mutual funds are generating returns at the expense of other investors not included in BvB’s calculations. Given that the US equity market is dominated by institutional investors, it is not immediately clear who is the losing group of active investors in this case. Other institutions such as hedge funds, or asset owners that invest directly rather than outsourcing, are typically well-resourced professional investors. The evidence on hedge funds suggests they do even better than mutual funds (see Agarwal, Mullally and Naik, 2015(5)). Fund managers could be extracting substantial value-add from private investors, given that there is evidence that private investors tend to underperform (e.g. Barber and Odean, 2013)(6). Perhaps, but this seems unlikely given that private investors are a limited pool.
When examining net returns after fees, BvB find outperformance based on a simple average, but underperformance weighted by assets. The negative asset-weighted result is also a relevant result in the current context, and it is not fully consistent with a GS equilibrium which predicts it should be zero. But then again, the net returns are not statistically significant. BvB (2016, p138)(7) comment on their net return results as follows:
“A positive net alpha implies that capital markets are not competitive. A negative net alpha implies that some investors are irrational in that they are committing too much money to active management. We find that the average net alpha to investors is statistically indistinguishable from zero. Thus we cannot reject the hypothesis that investors are rational and capital markets are fully competitive. As a result, managers are able to capture all economic rents their skills provide.”
The broad message arising from BvB is that active managers possess ‘skill’ and that those with greater skill accrue greater AUM and earn more fees in aggregate dollar terms. In equilibrium, the value that managers create is captured for themselves via the fees. Meanwhile, the average investor in US equity mutual funds is not significantly worse off for investing actively relative to investing passively. Overall, what BvB describe approaches a GS equilibrium where the fees paid for manager insight is tantamount to the cost of seeking information, and managers are capturing the value arising from generating that information.
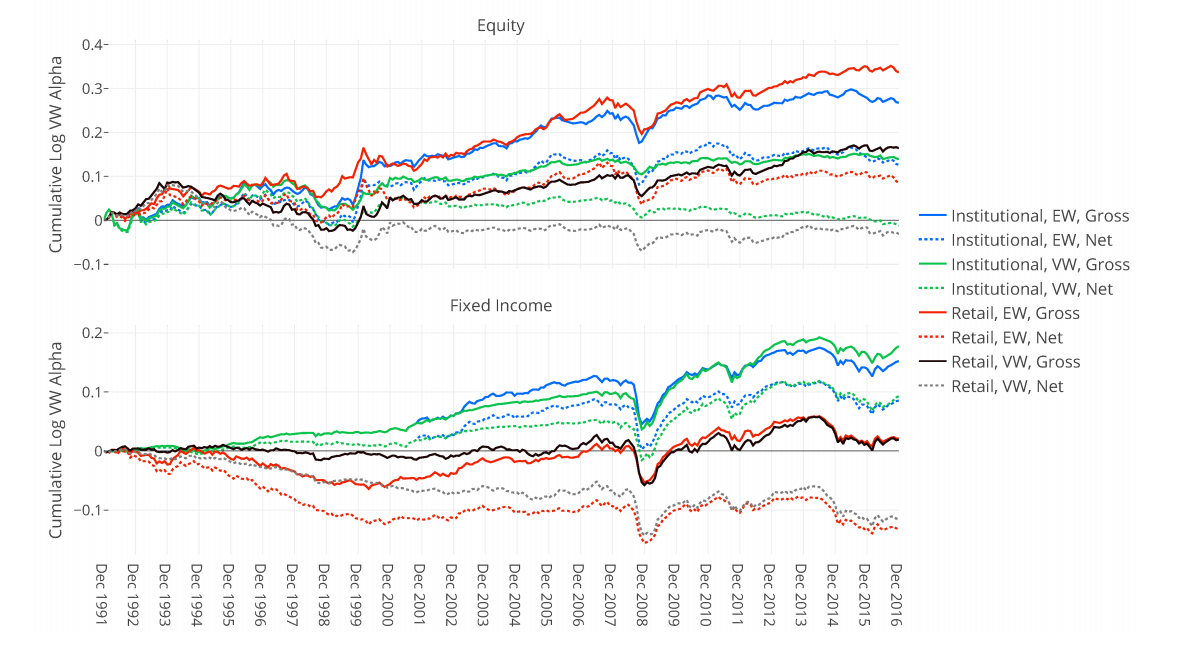
BvB only examines US equity mutual funds. In a recent paper, Leippold and Rueegg (2019)(8) examine aggregated performance for all equity and fixed income categories within the global Morningstar mutual fund database. Leippold and Rueegg (LR)(9) compare the performance of active funds versus passive funds within each category, including returns both equally-weighted and asset-weighted, before-fees (gross) and after fees (net), and for institutional versus retail funds. While the results vary across categories, the typical finding is that active funds outperform passive funds in aggregate in gross terms, but are closer to line ball in net terms. They explicitly comment that only three categories (out of 63 categories, as listed in their appendix) reveal results that are inconsistent with GS and hence consistent with Sharpe’s proposition, including US Equity Large Cap Blend, Canada Fixed Income and Euro Fixed Income. A key summary chart from their paper is copied below, although bear in mind this aggregates across fund categories. In this chart, only the aggregate results for retail fixed-income accord with what might be expected under Sharpe’s proposition. The other series plotted in accord with a GS equilibrium where active funds generate positive gross returns. LR also has a lot to say about how active returns vary across categories, which I will draw on further below.
5. What about all the evidence that ‘active management underperforms’?
There is a general perception that there exists a strong body of evidence that active managers do not create value for investors, and in fact, largely destroy value on average. I argue here that this view is too harsh, and in any case, does not in itself provide proof of Sharpe’s proposition. As there are a number of dimensions to the story, I will take you on a journey. I start by outlining some aspects of the academic literature for context, then drill down into some of the key issues, before circling back to provide an overall summary.
Aspects of the academic research on active management
A consistent conclusion drawn from the research is that the average US equity mutual fund has not delivered positive active returns to investors. For example, Jones and Wermers (2011)(11) state in their review article:
“Following Jensen’s seminal study (1968), numerous studies have reached virtually the same conclusion: The average actively managed mutual fund does not capture alpha, net of fees and expenses.” (12)Jones and Wermers (2011)
This result is sometimes taken as clear evidence that active management should be avoided, often in conjunction with an appeal to Sharpe’s proposition. This is overreach. A number of aspects of this body of research mean that it is wrong to draw the conclusion that it implies active management should always be avoided. Nor should this research be taken as proof of Sharpe’s proposition. The finding that the average manager underperforms after fees arises in the following context:
- Returns are typically measured after deducting fees as appearing in the database, the average of which can be heavily influenced by the higher ‘rack rate’ fees paid by retail investors. This skirts two issues:
- What gross returns were delivered: the main test of Sharpe’s proposition
- If there are positive gross returns, whether the net return could be positive for investors who pay lower fees than those who pay higher fees
- The bulk of findings relate to US equity mutual funds, which comprise a majority of retail funds along with some institutional funds offered as pooled mandates to larger investors. Any finding based on this data need not generalize to other areas, such as:
- Institutional funds that are managed under segregated mandates (i.e. separately managed accounts)
- Other equity markets
- Other asset classes
- The research often tends to focus on the average or median returns across a manager sample. This generates dissonance with Sharpe’s proposition in a number of ways:
- Sharpe’s proposition relates to all active investors, not a subset
- Sharpe’s proposition relates to aggregate (asset-weighted) returns, not a simple average or median
- The benchmarking issue is fraught. The analysis typically evaluates returns against indices and factor models without necessarily considering the costs involved, or whether the benchmarks used are investible at the time.
Gross versus net returns
A closer look at the research results often reveals signs that the average active manager has created value for investors at the gross level, albeit often not statistically significant. Above, I described the findings of BvB and LR pointing to positive gross value-add. This result is seen elsewhere. For example, in the widely-cited paper of Fama and French (2010)(13), the average gross return is 0.18% p.a. based on the CAPM (i.e. adjusting for the market only), and 0.39% under the 4-factor model that also adjusts for exposure value, size, and momentum. A similar pattern emerges from Busse, Goyal, and Wahal (2010)(14), who examine the performance of institutional US equity funds. While these authors highlight net alpha as being “statistically indistinguishable from zero”, a closer look reveals average gross benchmark-adjusted returns of 0.49% equally-weighted and 0.16% value-weighted. In addition, evidence exists that managers possess skills when examining the performance of the stocks they hold or trade, e.g. Wermers (2000)(15); Baker et al. (2010)(16); Anand et al. (2012)(17); Wermers, Yao, and Zhao (2012)(18). Overall the research seems to support the concept that active managers have added some value at the gross level, implying that either Sharpe’s proposition is not supported and/or active managers are generating positive active returns at the expense of other active investors. The issue is hence not whether US active equity mutual funds create value on average. Rather, the key question is the extent to which this value add is transferred to investors. Fees are a key flashpoint in this respect. I discuss them next.
Fees matter … a lot
The central role that fees play in whether active managers create value for investors is often overlooked. Much of the research into the performance of active managers uses the expense ratio appearing in the database being used, of which management fees are the main component. For example, the average active expense ratio in the CRSP mutual fund database – widely used by academics – is about 1.3%. This is reflected in the difference between gross and net returns reported by Fama and French (2010)(19), for instance. The Investment Company Institute (2019) (20) reports the average expense ratio for US equity mutual funds of 1.26% in 2018, having trended down from 1.68% in 2003. When focusing on the average net active return earned by active managers, it is the average fee that impacts on the results.
The average fee does not apply to all investors and can be boosted by the fees paid by retail investors. Meanwhile, the bulk of assets under management accesses managers via wholesale channels and does not pay the retail rack rate. The weighted average expense ratio on US equity mutual funds reported by the Investment Company Institute (2019) (21) for 2018 is 0.55%, reflecting 0.76% on active funds and 0.08% index funds. This is well below the simple average of 1.26%. LR report average fees of 1.18% for retail equity funds and 0.86% for institutional equity funds. These numbers are for pooled funds. Institutional investors pay even lower fees on segregated mandates(22). For instance, Mercer (2016)(23) reports fees on US equity core institutional mandates2 of $500 million of 0.43% for All Caps and 0.32% for Large Caps.
The fee used to estimate net returns can be very influential when averaging net returns over large samples, given that average active returns are often a modest number better measured in basis points. Indeed, the fee assumption itself can drive the finding that the average manager underperforms in net terms. For example, the average alpha reported by Fama and French (2010)(24) ranges between -0.92% and -1.10%. These numbers would be shifted nearer zero if institutional fees were applied rather than the average expense ratio of ~1.3%. The S&P SPIVA analysis(25), which regularly highlights the percentage of active managers that underperform the index, is also impacted by the average fee. The March 2019 SPIVA report finds that 89% of US equity funds underperformed the index over the last 15 years. Given that the net return difference to the index over the period is -1.43% on average and -0.73% asset-weighted, the fee deducted matters a lot to the outcome. If fees levels for institutional mandates were applied, it seems probable that the portion of managers underperforming could be much closer to 50% on average, and less than 50% on an asset-weighted basis for the funds being examined by S&P.
Finally, it is worth noting that fees for passive management are not zero, and in fact can be much higher than perceived for small retail investors in some circumstances. The Investment Company Institute (2019) (26) reports average expense ratios in 2018 for index equity mutual funds at 0.62% (this is not a typo – see page 5 of the report); although the asset-weighted average is only 0.08% reflecting larger index funds being available at very low fees. Again the impact of the retail rack rate on the simple average versus the fees paid on the bulk of the assets comes into play. A direct example is that Vanguard charges a fee of 0.75% for its Vanguard Index Australian Shares Fund for investments up to $50,000, decreasing progressively thereafter(27). This product meanwhile has an expense ratio of about 0.16%, and is available in ETF form at a fee of 0.10%. I have been told it may be purchased at a minuscule fee by large institutions. Fees for passive alternatives are often not considered in evaluating active management, with active performance traditionally being assessed against the returns for indices or factor portfolios from which no costs are deducted. Taking passive fees into account can further affect the comparisons between active and passive funds across different investor types.
The point is that fees are far from innocuous when evaluating whether active managers add value versus passive alternatives. The fact that fees can vary across fund share classes and investor types is an important feature that is glossed over when research focuses on the return of the ‘average’ manager. Not only does the existence of some high fee funds within the data contribute to the impression that the average manager does not create value by dragging up the average expense ratio, but the message that active management may have created value for some investors and not others gets lost in translation. The upshot is that the net return earned from active management can vary significantly across investors, depending on the fee they pay. Investing with active managers may work for institutions that pay modest fees, while not working for retail investors who pay the retail rack rate.
Institutional mandates vs. pooled funds
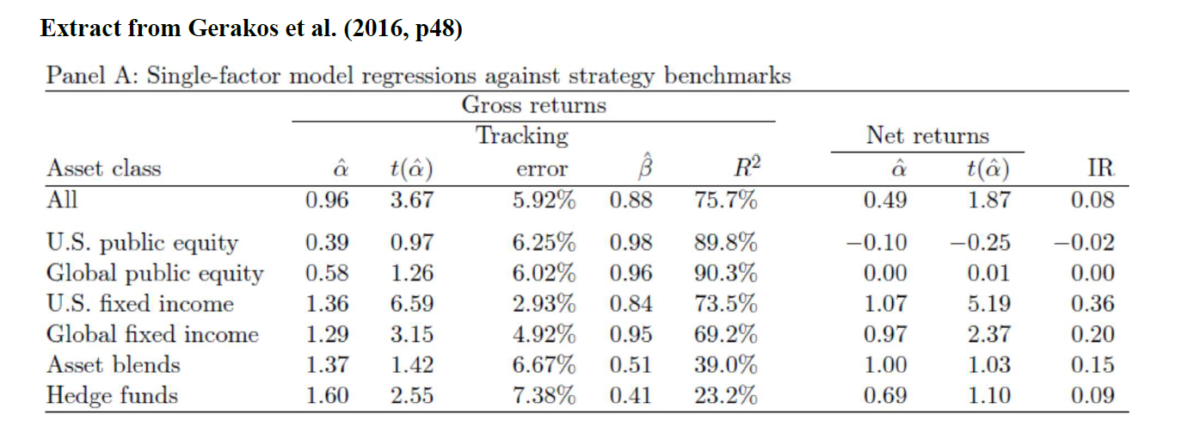
Research on institutional mandates is less prevalent than examining pooled funds, largely because data on segregated mandates are less readily available. While the results are mixed, there is evidence that the funds used by institutional investors deliver not only gross but also net outperformance. Perhaps the most comprehensive study is undertaken by Gerakos, Linnainmaa, and Morse (2016)(28). They access a database of 22,289 funds used by institutional asset owners over the period 2000-2012, comprising $25 trillion in assets under management (AUM) in June 2012 – more than half of the institutional capital delegated to asset managers at that time. They find that these asset manager funds outperformed their benchmarks by 96 basis points per year before fees, and by 49 basis points after fees.
An example of the divide between institutional and retail funds can be found in studies examining the performance of global equity managers. Researchers that are able to access institutional datasets tend to find outperformance albeit of varying significance, e.g. Dyck, Lins, and Pomorski (2013)(29), Busse, Goyal, and Wahal (2014)(30), Gerakos et al. (2016)(31), Gallagher et al. (2017)(32). Meanwhile, papers considering global equity funds from either the Morningstar or CRSP databases uncover much weaker performance, e.g. Huij and Derwall (2011)(33) ; Breloer, Scholz, and Wilkens (2014)(34); Tsai and Wu (2015)(35).
While there may be some survivorship or selection bias at play given the nature of the databases being used, the results for institutional mandates nevertheless stand in stark contrast to the view that there is pervasive evidence that active management underperforms. Clearly, things are quite different in ‘insto-land’. The performance difference between institutional mandates and pooled funds is due in large part to lower fees, particularly relative to retail-orientated funds. For instance, LR finds that institutional pooled funds tend to deliver higher net returns than retail pooled funds and that this is largely related to the fee difference. However, segregated mandates also have other advantages. They support better manager oversight and can help insulate against the adverse impact of fund flows arising from the actions of other investors. Research has estimated that the need to trade in response to investor flows can incur a return cost of around 1% p.a.; see Edelen (1999)(36); Coval and Stafford (2007)(37); Chen, Goldstein, and Jiang (2010)(38).
Dangerous to generalize from the US findings
If there is anywhere that active managers are going to struggle, it is likely to be in the US. The US equity market is highly institutionalized and probably the most competitive in the world. It is precarious to rule out the possibility that active management might succeed elsewhere based on the performance of US equity funds. Although the evidence from other markets and asset classes is comparatively thin, it does suggest that greater potential exists for active management to add value outside of US equities. The divide between active manager performance in US equities versus other contexts comes through starkly in three papers. First, LR found that the negative net returns delivered by US large-cap equity funds are not repeated in other markets, based on Morningstar data. The second and third papers examine the performance of funds used by institutional asset owners. Dyck, Lins, and Pomorski (2013, p200)(39) conclude:
(40) Dyck, Lins, and Pomorski (2013, p200)“For sophisticated institutional investors, active management outperforms passive management by more than 180 bps per year in emerging markets and by about 50 bps in EAFE markets over the 1993 to 2008 period. In U.S. markets, active management underperforms.”
A similar finding with regard to US equities versus other markets emerges from Gerakos et al. (2016)(41). Below is an extract from a key table in that paper. The estimates for gross returns are positive for all asset classes but are lowest for US equities. Their estimates for net returns are negative for US equities, zero in global equities, and positive in other asset classes examined. The results for US equities broadly square with Busse, Goyal, and Wahal (2010)(42) who examine institutional US equity funds.
A specific example with which I am familiar is Australian equity managers. For Australia, there is evidence that active managers have been able to deliver relatively strong gross active returns of sufficient magnitude to cover institutional fees and sometimes retail fees, e.g. see Chen et al. (2010)(44); Bennett et al. (2016)(45); Cao, von Reibnitz, and Warren (2019)(46). While just one market, it stands as a clear reminder that it is inappropriate to extrapolate the findings for US equities to other countries.
Although more evidence is needed, the finding that active managers underperform on average is not ubiquitous when one considers the research that looks beyond US equity mutual funds. Further, as LR points out, the results outside of US equities do not square with the notion of active management as a zero-sum game in gross terms, and a negative-sum game in net terms. Either Sharpe’s proposition does not hold in many non-US markets, or active managers in these markets are better placed to generate active returns at the expense of other investors.
Points of dissonance with Sharpe’s proposition
There is much dissonance between Sharpe’s proposition and the research that examines average manager returns. First, Sharpe’s proposition relates to all active investors, whereas active managers are only a subset. I further address this issue in section 6. Second, Sharpe’s proposition relates to aggregate (asset-weighted) returns, not the average or median manager. In this regard, asset-weighted returns for active equity managers are often lower than the equally weighted returns, e.g. see Busse et al. (2010)(47), Fama and French (2010)(48), BvB (2015, 2016)(49) and LR (2019)(50). These findings suggest that focusing on gross asset-weighted returns would move a step closer to providing support for Sharpe’s proposition than the results based on simple averages. Third, academic research often evaluates returns using indices and factor models without necessarily considering the costs involved in accessing the benchmark, or even whether the benchmark was investible at the time. In particular, factor models do not gel with Sharpe’s proposition at a rudimentary level (they are a form of active investment under his framework); and it is highly debatable whether they are fair benchmarks (see Cremers, Petajisto and Zitzewitz, 2013)(51). However, applying factor models does not seem to alter the estimates of active returns in any systematic manner, with excess returns versus the index often similar and sometimes lower than factor-adjusted returns depending on the study. Perhaps a bigger issue is that the costs of accessing passive alternatives are not accounted for properly, including the fees and trading costs entailed in implementing a passive strategy. On this point, the work of LR comparing realized returns for active and passive funds is welcome. In any event, there is considerable discord between the results for active managers as reported in much of the widely-cited academic research and Sharpe’s proposition which is framed around the asset-weighted performance of all active investors relative to the alternative of investing passively.
Circling back to summarize …
Two themes emerge from my selective tour of the academic research on the performance of active managers:
- It is wrong to form the general conclusion that there is clear academic evidence that active managers do not create value for investors on average. Indeed, this finding emerges as highly conditional. It largely applies to US equity mutual funds, especially when purchased by retail investors who pay higher fees. It should not be generalized to institutional investors, especially those who are large enough to access segregated mandates and who pay modest fees. Nor can it be taken as applying across all markets or asset classes.
- Studying the net performance of the average active manager should not be taken as a direct test of Sharpe’s proposition. The proposition is best tested by evaluating cap-weighted gross returns, not average net returns. Further, examining the average alpha across a sample of active funds does not amount to a test of whether all active investors earn lower returns relative to passive investors.
6. Where is the wiggle room for active investors to outperform?
It is a truism that if the index comprehensively covers an investment universe and passive investors continually hold that index, then active investors must also hold the index in aggregate for things to sum up. The zero-sum game will then apply at the gross level. Hence it is important to address where this characterization of the industry structure might break down, and whether it opens up sufficient gaps to permit active investors to generate gross returns that are meaningfully greater than those earned by passive investors. Pedersen (2018)(52) does an excellent job of discussing this issue. Below I summarise his key points while expanding on a few areas. On balance, there does appear to be some meaningful openings for active investors to outperform as a group. However, it should also be recognized that the wiggle room is ultimately limited, and there will be some cap on the extent to which active investors as a group can earn higher returns than passive investors.
First, the index benchmarks are incomplete that are used to measure market returns, and around which passive investment products are formulated. Indices typically do not contain all available assets within an investment universe. For instance, the S&P 500 or Russell Indices do not contain all US stocks. The widely-used MSCI World and All Country World Index (ACWI) cover about 85% of the investible universe across 23 developed and 26 emerging markets. These key indices do not contain all available stocks in the markets they cover and do not include all markets, e.g. frontier markets. MSCI makes adjustments for free float and uses inclusion factors that lead to some constituents being incorporated at a discount to full market cap. For example, MSCI currently applies a 5% inclusion factor to China A-shares, which it plans to increase to just 20% in three steps(53). Thus there are substantial gaps relative to full coverage of the ‘market’. This provides ample scope for the portfolios of active investors to diverge from passive investors who replicate an index.
Second, the investment universe is dynamic, not static. An indexed fund has to trade in order to track the index, although I understand that many index fund providers exercise some leeway in implementing trades in order to limit the market impact. The requirement to trade can arise for a variety of reasons, including:
- Trading due to flows arising from investor actions, such as new funds invested, withdrawals and rebalancing between asset classes, e.g. net creation and redemption of units in index ETFs precipitates buying and selling
- Reinvestment of income received (and principal at maturity in the case of fixed income)
- Adjustments following index reconstitutions
- Responses to corporate actions, such as primary or secondary offerings, share repurchases, merger and acquisition activity, and so on.
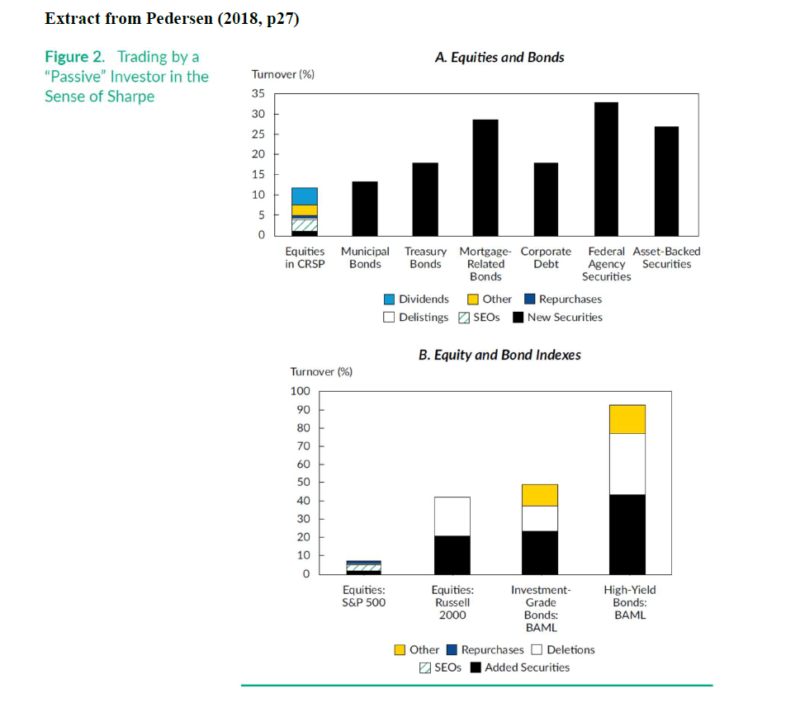
Pedersen (2018)(54)) provides estimates of the magnitude of trading related to some of these sources, which is reproduced through the chart below. You may find the turnover numbers surprisingly large. His turnover estimates are in the order of 5-10% for the S&P500, 10-15% for all the securities in the CRSP database (a reasonable proxy for the overall US equity market), and over 40% for the Russell 2000. The turnover estimates for fixed income are even larger, in part because fixed-income securities roll over as they reach maturity. Pedersen’s estimates do not allow for investor flows, which means that they most probably understate the effective turnover of passive funds. This trading activity provides room for performance gaps between passive investors that aim to closely track an index and active investors as a group. In particular, the associated trades can provide opportunities for transfers of wealth between active and passive investors. This issue is discussed in depth by Pedersen (2018)(55), as well as Anderson (2017)(56).
To illustrate how turnover by passive funds might create opportunities for active investors to enhance returns, consider an initial public offering (IPO). There is often a gap between the investment in an IPO and its inclusion in an index. Whatever return is earned in the lead-up to index inclusion appears as an ‘active return’ that those replicating the index will not access. If the IPO performs well over this period (which often happens in the short-term, even if many IPOs prove to be poor long-term investments), the active investor will generate a higher return than the index. But can’t index funds access IPOs as well? Perhaps. Even then, this is not all it seems, as Pedersen explains. Active investors can choose their level of participation in IPOs, and this opens up an opportunity for them to game the passive investors. In a hotly sought-after IPO, it is plausible that passive investors (if they participate) could be allocated less than their share. If the price pops after the issue, the passive investors end up bidding the shares of the active investors at higher prices in order to get to a market-weight position. In other words, they are underweight and hence effectively active investors during the transition phase. The wash-up is that passive investors end up buying from active investors at unattractive prices, resulting in a wealth transfer. On the other hand, for unpopular IPOs, the passive investors will have no problems in securing their fill from the go-get.
Anderson (2017)(58). further develops the line of argument. He notes that when index funds need to trade, they are often stacked on one side – either buyers or sellers. They are not holding stocks at market weights until the trades occur, and will need to ‘tease out’ active investors to take the other side of the trade. Furthermore, passive investors are relatively price-insensitive. Although they may attempt to execute trades to minimize market impact, ultimately they need to trade and the price paid is not the primary consideration. This situation acts to the net benefit of ‘informed’ active investors. From the perspective of Sharpe’s proposition, until the required trades occur, the index funds are actually temporary relatively price-insensitive active investors who hold the opposite position to the genuine active investors. To the extent they need to move the stock price to get to market-weight and hence close their active position, wealth will have transferred from the index funds to active investors. Anderson suggests that, as the portion of the market held passively rises, this mechanism of market-clearing becomes more important and the opportunities for active investors will increase.
It is difficult to place reliable numbers on how these factors might impact the relative returns between active and passive investors, in part because they also rely on active investors making good decisions for them to benefit. Pedersen offers a few ballpark figures, citing 18 bps from IPOs, 6 bps from secondary equity offerings, and possible trading costs of upwards of 20 bps for index funds associated with their required turnover. However, he is (understandably) coy about citing a specific number. Nevertheless, it is clear that there exists a variety of openings that leave Sharpe’s proposition as far from water-tight.
7. Differing investor objectives
Sharpe’s proposition is expressed in return space. To my knowledge, there has been no discussion of whether Sharpe’s proposition is partially formed because it assumes that investors care only about return levels, implying that they are risk-neutral. Basically, it ignores the possibility that investors may find it optimal to hold the market in other than cap-weighted form.
It is rational for investors with differing objectives and differing tolerances for various risks to hold differing portfolios. Admitting this possibility breaks the nexus with market-cap weights as the baseline position. That is, it may be rational for even passive investors not to seek to hold the market, and perhaps even be willing to accept a lower return or incur costs to achieve an alternate positioning. In this world, everyone would be ‘active’ investors under Sharpe’s proposition, with some appearing winners and others losers as measured by relative returns versus the cap-weighted market. Nevertheless, all investors may still be better off in utility terms to the extent they have achieved their preferred position. Sharpe’s proposition is blind to this possibility.
This somewhat subtle point is more readily understood by considering fixed-income portfolios in the context of liability-driven investing. Liability-driven investors with different liabilities should be holding different fixed-income portfolios by duration, credit risk, and so on. This will look like active investing through the prism of Sharpe’s framework. Some investors will win and some will lose relative to the overall fixed-income universe in terms of returns, depending on how the yield curve and credit spreads happen to move. Nevertheless, all investors may still be satisfied with the outcome from the point of view of (say) having protected their funding ratios to the extent that is it possible or desirable.
A similar logic extends to other ways in which objectives and preferences may differ across investors, including the type of risks that investors are willing to bear; investment horizons; need for liquidity; and differences in tax status. For example, an investor with a high demand for liquidity may choose to hold more liquid securities even though they offer lower returns, leaving the higher-returning illiquid securities to those with tolerance for illiquidity. This could be a win-win for all but would be considered a win-lose under Sharpe’s proposition. The concept being raised here is closely related to the notion raised by Scholes (2004)(59) that risk transfer and liquidity provision can provide two additional sources of (sustainable) return generation in addition to beta and alpha as traditionally defined. Scholes’ intuition is that some investors may be able to reap additional returns by providing risk transfer or liquidity provision services to other investors, who willingly pay for those services in order to reach their preferred position.
8. Sharpe’s proposition still leaves scope for active fund managers to outperform
There is nothing in Sharpe’s proposition that prohibits active fund managers from outperforming at the expense of other active investors who underperform. Indeed, Sharpe (1991)(60) openly acknowledges this possibility. Given that the active versus passive debate is typically framed as a choice between active fund managers and passive investments such as index funds, this issue arises as rather central. It means that consideration should also be given to whether active managers have some competitive advantage over other investors when deciding whether an active approach may be appropriate.
Whether active managers can outperform overall at the expense of other active investors is a moot point. However, it is likely to be highly contingent on the market environment, in particular, the nature of other investors in the market. It makes sense that it would be harder for US active managers to outperform given that the US market is dominated by institutions, meaning there are fewer ‘patsies’ to exploit. Further, there is some evidence that US equity markets have become more competitive over time, making it even more difficult for active managers to outperform (see Pástor, Stambaugh and Taylor, 2015)(61). Evidence also exists that active management does better in sectors where the competition is lower; see Hoberg, Kumar, and Prabhala (2017)(62)
Consistent with this concept, there are signs that active managers outperform in markets where there appears to exist a wider spread of investor types. For example, active funds appear to do better in emerging markets (e.g. see Huij and Post, 2011(63); Dyck et al. 2013(64) ; Gallagher et al. 2017(65)), noting that these markets are often dominated by private investors. The outperformance of Australian equity funds versus local benchmarks that I referred to above may not be so mysterious considering the prevalence of overseas investors operating in that market who are investing against different benchmarks (e.g. MSCI World or MSCI Asia ex. Japan). In my own experience, overseas investors view and use Australian stocks differently to the locals. This may open up the scope for Australian managers to beat the S&P/ASX200 simply because overseas investors are playing a different game. Although admittedly my contentions here are merely informed guesses.
In summary, Sharpe’s proposition that active investors should underperform as a group after fees should not be translated to implying that active managers must underperform, given they exist as one sub-group amidst a broad spectrum of active investors. It is important to look beyond Sharpe’s proposition in choosing whether to use active managers and consider whether the market environment may support value generation by active managers at the expense of other investors.
9. A decision framework
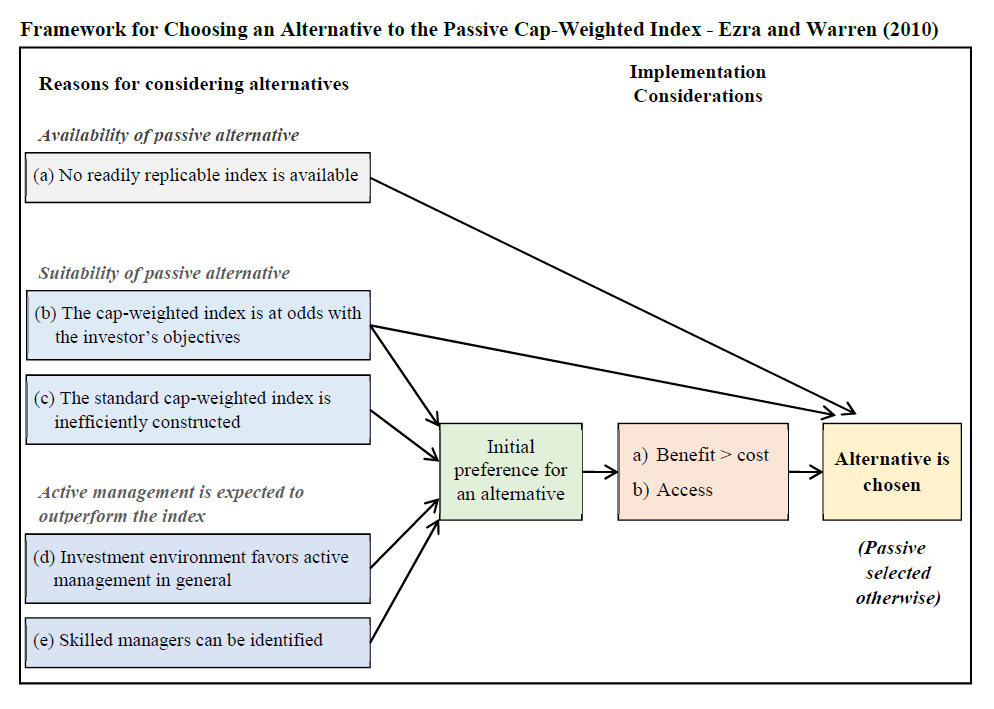
Some years ago, Don Ezra and I put forward a framework for deciding when to choose an active alternative over investing in a cap-weighted index; see Ezra and Warren (2010a)(66), 2010b(67)). Posing the question as a choice between a cap-weighted index and some other alternative dovetails with Sharpe’s framework. Our five reasons for considering an alternative to cap-weighting are summarized below:
- Absence of a replicable index in the market of interest. This is most relevant for alternative asset classes.
- A cap-weighted index is available but is unsuitable for the investor’s purpose. We cited liability-driven investing, socially-responsible investing and tax-effective investing as examples. This speaks to the potential existence of differing investor objectives, as was discussed above in Section 7.
- The index itself is inefficient, meaning that one can do better than simply replicating it. We alluded to fundamental indexation and the shortcomings of fixed-income and commodity indices. It strikes me that the subsequent growth of smart beta has much to do with the judgment that cap-weighting is inefficient.
- The environment is conducive to active managers outperforming. Much of the discussion appearing in this paper addresses this issue in light of Sharpe’s proposition.
- You have the ability to identify skilled managers. This recognizes that there may be managers available that can outperform even if Sharpe’s proposition does indeed hold; and that having the skill to identify these managers could justify an active approach in its own right.
Addressing the above five reasons should help establish if there exists an initial case for an active alternative. The cost (i.e. fee) and the ability to access the active alternative are then considered, and a final decision is made. A passive cap-weighted approach is the default if there is no clear reason to choose an active alternative, or the costs or access are prohibitive. A version of the schematic setting out our decision framework appears over.
Sharpe’s proposition largely relates to point (4), given that it suggests that the environment is rendered less conducive to outperformance by active managers because they are involved in a zero-sum game in gross returns and a negative-sum game in net terms. Although when we were discussing point (4), Don and I were more focused on the circumstances where active investment managers might outperform at the expense of other investors, arguing that this would vary with the market in question, as well as over time, i.e. the active management cycle.
It is worth noting that point (5) related to the identification of skilled managers is arguably more important than the performance of active managers on average, given that investors typically invest through a selection of active funds rather than buying the entire universe. Manager selection is not an easy task, and the literature examining the fund choices by investors suggests that many invest and redeem at the wrong time, e.g. see Goyal and Wahal (2008)(69). Nevertheless, the experience of asset owners with active management as revealed in studies such as Dyck et al. (2013)(70) indicates that some do have access to manager selection skill. Clearly, this is another dimension along which the situation will vary across investors.
The key point is that the performance of the typical active manager should be seen as one component within a wide canvas of relevant considerations. I believe that the above framework is more useful for thinking about the choice between active and passive investing than primarily focusing attention on how active managers perform as a group. It requires that focus is extended beyond the debate over whether active investing is unlikely to work based on Sharpe’s proposition, or the evidence on the performance of the average manager. It rests on the idea that it is more fruitful to establish whether an active approach or passive approach might be most effective given the particular circumstances.
10. Conclusions
My aim has been to explain why Sharpe’s proposition about active investing should not be taken as an indisputable truism. While it is presented similarly to a mathematical law, the underlying logic is not as water-tight as it may seem. Further, it is not generally supported by the research examining the active funds. Indeed, the research findings seem to accord more with a Grossman and Stiglitz equilibrium than Sharpe’s proposition. Although it should also be remembered that this research is not directly testing Sharpe’s proposition, as examining the performance of active managers considers only a subset of active investors. In addition, there is evidence that active managers outperform after costs once stepping outside of the context of US equity mutual funds. Better performance emerges for active funds outside of the US, and for institutional asset owners who can access active management at lower fees. While more research is definitely needed, that which exists is sufficient to conclude that it is premature to write-off active management based on Sharpe’s proposition or the results for US equity mutual funds.
For me, the most important question is whether active or passive (or some mix) is the better choice for a particular investor given the circumstances they happen to face. Retail investors who pay high fees and do not have access to manager selection skills might think twice before using active managers. Before doing so, they might consider whether an active approach either best meets their objectives, or if the market environment is conducive to active managers adding enough value to cover the fee they will be paying. Otherwise, they may end up playing what is, for them, a negative-sum game. For institutional asset owners that have access to segregated mandates at a low fee, and feel confident in selecting managers, the chances of success with an active approach can be much higher. The key message is that ‘it depends’.
References:
Anand, A., Irvine, P., Puckett, A. and Venkataraman, K. 2012. Performance of institutional trading desks: an analysis of persistence in trading costs. Review of Financial Studies, 25(2), pp.557–598.
Anderson, C., 2017. The passive vs. active conundrum: A new perspective on the arithmetic of index investing. Available at: https://papers.ssrn.com/sol3/papers.cfm?abstract_id=2986458.
Agarwal, V. Mullally, K.A. and Naik, N.Y. 2015. The economics and finance of hedge funds: A review of the academic literature. Foundations and Trends in Finance, 10(1), pp.1-111.
Baker, M., Litov, L., Wachter, J. and Wurgler, J. 2010. Can mutual fund managers pick stocks? Evidence from their trades prior to earnings announcements. Journal of Financial and Quantitative Analysis, 45(5), pp.1111–1131.
Barber, B.M. and Odean, T. 2013. The behavior of individual investors. Handbook of the Economics of Finance, 2, pp.1533-1570).
Bennett, S., Gallagher, D.R., Harman, G., Warren, G.J. and Xi, L., 2016. Alpha generation in portfolio management: Long-run Australian equity fund evidence. Australian Journal of Management, 41(1), pp.107-140.
Berk, J.B. and Van Binsbergen, J.H., 2015. Measuring skill in the mutual fund industry. Journal of Financial Economics, 118(1), pp.1-20.
Berk, J.B. and van Binsbergen, J.H., 2016. Active managers are skilled: On average, they add more than $3 million per year. Journal of Portfolio Management, 42(2), p.131-139.
Breloer, B., Scholz, H. and Wilkens, M. 2014. Performance of International and Global Equity Mutual Funds: Do Country Momentum and Sector Momentum Matter? Journal of Banking and Finance, 43, pp.58-77.
Busse, J.A., Goyal, A. and Wahal, S., 2010. Performance and persistence in institutional investment management. Journal of Finance, 65(2), pp.765-790.
Busse, J., Goyal, A., and Wahal, S. 2014. Investing in a Global World. Review of Finance, 18(2), pp.561-590.
Cao, Y., von Reibnitz, A. and Warren, G.J., 2019. Return Dispersion and Fund Performance: Australia – the Land of Opportunity? Available at: https://papers.ssrn.com/sol3/papers.cfm?abstract_id=3372657
Chen, C., Comerton-Forde, C., Gallagher, D.R. and Walter, T.S., 2010. Investment manager skill in small-cap equities. Australian Journal of Management, 35(1), pp.23-49
Chen, Q., Goldstein, I. and Jiang, W., 2010. Payoff complementarities and financial fragility: Evidence from mutual fund outflows. Journal of Financial Economics, 97(2), pp.239-262.
Coval, J. and Stafford, E., 2007. Asset fire sales (and purchases) in equity markets. Journal of Financial Economics, 86(2), pp.479-512.
Cremers, M., Petajisto, A. and Zitzewitz, E., 2013. Should benchmark indices have alpha? Revisiting performance evaluation. Critical Finance Review, 2, pp.1-48. Available at: http://cfr.ivowelch.info/published/cfr-007.pdf.
Dyck, A., Lins, K.V., and Pomorski, L. 2013. Does active management pay? New international evidence. Review of Asset Pricing Studies, 3(2), pp.200-228.
Edelen, R.M., 1999. Investor flows and the assessed performance of open-end mutual funds. Journal of Financial Economics, 53(3), pp.439-466.
Ezra, D. and Warren, G., 2010a. When should you choose an alternative to passive investing? Russell Research (January). Available at: https://russellinvestments.com/-/media/files/nz/insights/1001-when-should-youchoose-an-alternative-to-passive-investing.pdf?la=en-nz
Ezra, D. and Warren, G., 2010b. When should you choose an alternative to passive investing? Journal of Portfolio Management, 36(4), pp.5-6.
Fama, E.F. and French, K.R., 2010. Luck versus skill in the cross-section of mutual fund returns. Journal of Finance, 65(5), pp.1915-1947.
French, K.R., 2008. Presidential address: The cost of active investing. Journal of Finance, 63(4), pp.1537-1573.
Gallagher, D.R., Harman, G., Schmidt, C.H. and Warren, G.J. 2017. Global equity fund performance: An attribution approach. Financial Analysts Journal, 73(1), pp.56-71.
Gerakos, J., Linnainmaa, J. and Morse, A., 2016. Asset manager funds. Chicago Booth Research Papers, No.16-02. Available at: http://papers.ssrn.com/sol3/papers.cfm?abstract_id=2733147.
Goyal, A and Wahal, S. 2008. The Selection and Termination of Investment Management Firms by Plan Sponsors”, Journal of Finance, 63(4), pp.1805-1847.
Grossman, S.J. and Stiglitz, J.E., 1980. On the impossibility of informationally efficient markets. The American Economic Review, 70(3), pp.393-408.
Hoberg, G., Kumar, N. and Prabhala, N., 2017. Mutual fund competition, managerial skill, and alpha persistence. Review of Financial Studies, 31(5), pp.1896-1929.
Huij, J., and Derwall, J. 2011. Global equity fund performance, portfolio concentration, and the fundamental law of active management. Journal of Banking and Finance, 35(1), pp.155-165.
Huij, J. and Post, T., 2011. On the performance of emerging market equity mutual funds. Emerging Markets Review, 12(3), pp.238-249.
Investment Company Institute. 2019. Trends in the expenses and fees of funds, 2018. ICI Research Perspective, 25(1), pp.1-32. Available at: https://www.ici.org/pdf/per25-01.pdf.
Jones, R.C. and Wermers, R., 2011. Active management in mostly efficient markets. Financial Analysts Journal, 67(6), pp.29-45.
Leippold, M. and Rueegg, R., 2019. How rational and competitive is the market for mutual funds? Review of Finance, 1-35 (in press).
Pástor, L., Stambaugh, R.F. and Taylor, L.A. 2015. Scale and skill in active management. Journal of Financial Economics, 116(1), pp.23-45.
Pedersen, L.H., 2018. Sharpening the arithmetic of active management. Financial Analysts Journal, 74(1), pp. 23-45
Mercer. 2016. Global asset manager fee survey 2016. Available at: http://www.mercersignatureevents.com/investmentforums/2017/gpm/downloads/Global-Asset-Manager-Fee-Survey-2016.pdf
Scholes, M.S. 2004. The future of hedge funds”. Journal of Financial Transformation, 10, pp.8-11.
Sharpe, W.F. 1991. The arithmetic of active management. Financial Analysts Journal, 47(1), pp.7-9.
Tsai, H.-J. and Y. Wu. 2015. Performance of foreign and global mutual funds: The role of security selection, region-shifting, and style-shifting abilities. Financial Review, 50(4), pp.517–545.
Wermers, R., 2000. Mutual fund performance: an empirical decomposition into stock-picking talent, style, transaction costs, and expenses. Journal of Finance, 55(4), pp.1655–1703.
Wermers, R., Yao, T. and Zhao, J. 2012. Forecasting stock returns through an efficient aggregation of mutual fund holdings. Review of Financial Studies, 25(12), pp.3490-3529.
References[+]
| ↑1 | Sharpe, W.F. 1991. The arithmetic of active management. Financial Analysts Journal, 47(1), pp.7-9.9 |
|---|---|
| ↑2 | French, K.R., 2008. Presidential address: The cost of active investing. Journal of Finance, 63(4), pp.1537-1573 |
| ↑3 | Grossman, S.J. and Stiglitz, J.E., 1980. On the impossibility of informationally efficient markets. The American Economic Review, 70(3), pp.393-408 |
| ↑4 | Berk, J.B. and Van Binsbergen, J.H., 2015. Measuring skill in the mutual fund industry. Journal of Financial Economics, 118(1), pp.1-20. Berk, J.B. and van Binsbergen, J.H., 2016. Active managers are skilled: On average, they add more than $3 million per year. Journal of Portfolio Management, 42(2), p.131-139. |
| ↑5 | Agarwal, V. Mullally, K.A. and Naik, N.Y. 2015. The economics and finance of hedge funds: A review of the academic literature. Foundations and Trends in Finance, 10(1), pp.1-111. |
| ↑6 | Barber, B.M. and Odean, T. 2013. The behavior of individual investors. Handbook of the Economics of Finance, 2, pp.1533-1570). |
| ↑7 | Berk, J.B. and van Binsbergen, J.H., 2016. Active managers are skilled: On average, they add more than $3 million per year. Journal of Portfolio Management, 42(2), p.131-139. |
| ↑8 | Leippold, M. and Rueegg, R., 2019. How rational and competitive is the market for mutual funds? Review of Finance, 1-35 (in press). |
| ↑9 | Leippold, M. and Rueegg, R., 2019. How rational and competitive is the market for mutual funds? Review of Finance, 1-35 (in press). |
| ↑10 | Leippold, M. and Rueegg, R., 2019. How rational and competitive is the market for mutual funds? Review of Finance, 1-35 (in press). |
| ↑11 | Jones, R.C. and Wermers, R., 2011. Active management in mostly efficient markets. Financial Analysts Journal, 67(6), pp.29-45. |
| ↑12 | Jones, R.C. and Wermers, R., 2011. Active management in mostly efficient markets. Financial Analysts Journal, 67(6), pp.29-45. |
| ↑13 | Fama, E.F. and French, K.R., 2010. Luck versus skill in the cross-section of mutual fund returns. Journal of Finance, 65(5), pp.1915-1947. |
| ↑14 | Busse, J.A., Goyal, A. and Wahal, S., 2010. Performance and persistence in institutional investment management. Journal of Finance, 65(2), pp.765-790. |
| ↑15 | Wermers, R., 2000. Mutual fund performance: an empirical decomposition into stock-picking talent, style, transaction costs, and expenses. Journal of Finance, 55(4), pp.1655–1703. |
| ↑16 | Baker, M., Litov, L., Wachter, J. and Wurgler, J. 2010. Can mutual fund managers pick stocks? Evidence from their trades prior to earnings announcements. Journal of Financial and Quantitative Analysis, 45(5), pp.1111–1131. |
| ↑17 | Anand, A., Irvine, P., Puckett, A. and Venkataraman, K. 2012. Performance of institutional trading desks: an analysis of persistence in trading costs. Review of Financial Studies, 25(2), pp.557–598. |
| ↑18 | Wermers, R., Yao, T. and Zhao, J. 2012. Forecasting stock returns through an efficient aggregation of mutual fund holdings. Review of Financial Studies, 25(12), pp.3490-3529. |
| ↑19 | Fama, E.F. and French, K.R., 2010. Luck versus skill in the cross-section of mutual fund returns. Journal of Finance, 65(5), pp.1915-1947. |
| ↑20 | Investment Company Institute. 2019. Trends in the expenses and fees of funds, 2018. ICI Research Perspective, 25(1), pp.1-32. Available at: https://www.ici.org/pdf/per25-01.pdf. |
| ↑21 | Investment Company Institute. 2019. Trends in the expenses and fees of funds, 2018. ICI Research Perspective, 25(1), pp.1-32. Available at: https://www.ici.org/pdf/per25-01.pdf. |
| ↑22 | ERISA/Non-ERISA Qualified Institutional Pool Funds. |
| ↑23 | Mercer. 2016. Global asset manager fee survey 2016. |
| ↑24 | Fama, E.F. and French, K.R., 2010. Luck versus skill in the cross-section of mutual fund returns. Journal of Finance, 65(5), pp.1915-1947. |
| ↑25 | See for instance: https://www.spglobal.com/_assets/documents/corporate/us-spiva-report-11-march-2019.pdf Note that S&P mentions that the returns are net of fees, but doesn’t disclose the fee basis on which performance is estimated. After some investigation, it appears they are deducting the reported fee, similar to Morningstar and CRSP. |
| ↑26 | Investment Company Institute. 2019. Trends in the expenses and fees of funds, 2018. ICI Research Perspective, 25(1), pp.1-32. |
| ↑27 | See: https://www.vanguardinvestments.com.au/retail/ret/investments/product.html#/fundDetail/retail/portId=8129/?overview |
| ↑28 | Gerakos, J., Linnainmaa, J. and Morse, A., 2016. Asset manager funds. Chicago Booth Research Papers, No.16-02. |
| ↑29 | Dyck, A., Lins, K.V., and Pomorski, L. 2013. Does active management pay? New international evidence. Review of Asset Pricing Studies, 3(2), pp.200-228. |
| ↑30 | Busse, J., Goyal, A., and Wahal, S. 2014. Investing in a Global World. Review of Finance, 18(2), pp.561-590. |
| ↑31 | Gerakos, J., Linnainmaa, J. and Morse, A., 2016. Asset manager funds. Chicago Booth Research Papers, No.16-02. |
| ↑32 | Gallagher, D.R., Harman, G., Schmidt, C.H. and Warren, G.J. 2017. Global equity fund performance: An attribution approach. Financial Analysts Journal, 73(1), pp.56-71 |
| ↑33 | Huij, J., and Derwall, J. 2011, Global equity fund performance, portfolio concentration, and the fundamental law of active management. Journal of Banking and Finance, 35(1), pp.155-165. |
| ↑34 | Breloer, B., Scholz, H. and Wilkens, M. 2014. Performance of International and Global Equity Mutual Funds: Do Country Momentum and Sector Momentum Matter? Journal of Banking and Finance, 43, pp.58-77. |
| ↑35 | Tsai, H.-J. and Y. Wu. 2015. Performance of foreign and global mutual funds: The role of security selection, region-shifting, and style-shifting abilities. Financial Review, 50(4), pp.517–545. |
| ↑36 | Edelen, R.M., 1999. Investor flows and the assessed performance of open-end mutual funds. Journal of Financial Economics, 53(3), pp.439-466. |
| ↑37 | Coval, J. and Stafford, E., 2007. Asset fire sales (and purchases) in equity markets. Journal of Financial Economics, 86(2), pp.479-512. |
| ↑38 | Chen, Q., Goldstein, I. and Jiang, W., 2010. Payoff complementarities and financial fragility: Evidence from mutual fund outflows. Journal of Financial Economics, 97(2), pp.239-262. |
| ↑39 | Dyck, A., Lins, K.V., and Pomorski, L. 2013. Does active management pay? New international evidence. Review of Asset Pricing Studies, 3(2), pp.200-228. |
| ↑40 | Dyck, A., Lins, K.V., and Pomorski, L. 2013. Does active management pay? New international evidence. Review of Asset Pricing Studies, 3(2), pp.200-228. |
| ↑41 | Gerakos, J., Linnainmaa, J. and Morse, A., 2016. Asset manager funds. Chicago Booth Research Papers, No.16-02. |
| ↑42 | Busse, J.A., Goyal, A. and Wahal, S., 2010. Performance and persistence in institutional investment management. Journal of Finance, 65(2), pp.765-790. |
| ↑43 | Gerakos, J., Linnainmaa, J. and Morse, A., 2016. Asset manager funds. Chicago Booth Research Papers, No.16-02. |
| ↑44 | Chen, C., Comerton-Forde, C., Gallagher, D.R. and Walter, T.S., 2010. Investment manager skill in small-cap equities. Australian Journal of Management, 35(1), pp.23-49 |
| ↑45 | Bennett, S., Gallagher, D.R., Harman, G., Warren, G.J. and Xi, L., 2016. Alpha generation in portfolio management: Long-run Australian equity fund evidence. Australian Journal of Management, 41(1), pp.107-140. |
| ↑46 | Cao, Y., von Reibnitz, A. and Warren, G.J., 2019. Return Dispersion and Fund Performance: Australia – the Land of Opportunity? |
| ↑47 | Busse, J.A., Goyal, A. and Wahal, S., 2010. Performance and persistence in institutional investment management. Journal of Finance, 65(2), pp.765-790. |
| ↑48 | Fama, E.F. and French, K.R., 2010. Luck versus skill in the cross-section of mutual fund returns. Journal of Finance, 65(5), pp.1915-1947. |
| ↑49 | Berk, J.B. and van Binsbergen, J.H., 2016. Active managers are skilled: On average, they add more than $3 million per year. Journal of Portfolio Management, 42(2), p.131-139. Berk, J.B. and Van Binsbergen, J.H., 2015. Measuring skill in the mutual fund industry. Journal of Financial Economics, 118(1), pp.1-20. |
| ↑50 | Leippold, M. and Rueegg, R., 2019. How rational and competitive is the market for mutual funds? Review of Finance, 1-35 (in press). |
| ↑51 | Cremers, M., Petajisto, A. and Zitzewitz, E., 2013. Should benchmark indices have alpha? Revisiting performance evaluation. Critical Finance Review, 2, pp.1-48. |
| ↑52 | Pedersen, L.H., 2018. Sharpening the arithmetic of active management. Financial Analysts Journal, 74(1), pp. 23-45 |
| ↑53 | See: https://www.msci.com/documents/10199/43f3ee8b-5182-68d4-a758-2968b4206e54 |
| ↑54 | Pedersen, L.H., 2018. Sharpening the arithmetic of active management. Financial Analysts Journal, 74(1), pp. 23-45 |
| ↑55 | Pedersen, L.H., 2018. Sharpening the arithmetic of active management. Financial Analysts Journal, 74(1), pp. 23-45 |
| ↑56 | Anderson, C., 2017. The passive vs. active conundrum: A new perspective on the arithmetic of index investing. |
| ↑57 | Pedersen, L.H., 2018. Sharpening the arithmetic of active management. Financial Analysts Journal, 74(1), pp. 23-45 |
| ↑58 | Anderson, C., 2017. The passive vs. active conundrum: A new perspective on the arithmetic of index investing. |
| ↑59 | Scholes, M.S. 2004. The future of hedge funds”. Journal of Financial Transformation, 10, pp.8-11. |
| ↑60 | Sharpe, W.F. 1991. The arithmetic of active management. Financial Analysts Journal, 47(1), pp.7-9. |
| ↑61 | Pástor, L., Stambaugh, R.F. and Taylor, L.A. 2015. Scale and skill in active management. Journal of Financial Economics, 116(1), pp.23-45. |
| ↑62 | Hoberg, G., Kumar, N. and Prabhala, N., 2017. Mutual fund competition, managerial skill, and alpha persistence. Review of Financial Studies, 31(5), pp.1896-1929. |
| ↑63 | Huij, J. and Post, T., 2011. On the performance of emerging market equity mutual funds. Emerging Markets Review, 12(3), pp.238-249. |
| ↑64 | Dyck, A., Lins, K.V., and Pomorski, L. 2013. Does active management pay? New international evidence. Review of Asset Pricing Studies, 3(2), pp.200-228. |
| ↑65 | Gallagher, D.R., Harman, G., Schmidt, C.H. and Warren, G.J. 2017. Global equity fund performance: An attribution approach. Financial Analysts Journal, 73(1), pp.56-71. |
| ↑66 | Ezra, D. and Warren, G., 2010a. When should you choose an alternative to passive investing? Russell Research (January) |
| ↑67 | Ezra, D. and Warren, G., 2010b. When should you choose an alternative to passive investing? Journal of Portfolio Management, 36(4), pp.5-6. |
| ↑68 | Ezra, D. and Warren, G., 2010b. When should you choose an alternative to passive investing? Journal of Portfolio Management, 36(4), pp.5-6. |
| ↑69 | Goyal, A and Wahal, S. 2008. The Selection and Termination of Investment Management Firms by Plan Sponsors”, Journal of Finance, 63(4), pp.1805-1847. |
| ↑70 | Dyck, A., Lins, K.V., and Pomorski, L. 2013. Does active management pay? New international evidence. Review of Asset Pricing Studies, 3(2), pp.200-228. |
About the Author: Geoff Warren
—
Important Disclosures
For informational and educational purposes only and should not be construed as specific investment, accounting, legal, or tax advice. Certain information is deemed to be reliable, but its accuracy and completeness cannot be guaranteed. Third party information may become outdated or otherwise superseded without notice. Neither the Securities and Exchange Commission (SEC) nor any other federal or state agency has approved, determined the accuracy, or confirmed the adequacy of this article.
The views and opinions expressed herein are those of the author and do not necessarily reflect the views of Alpha Architect, its affiliates or its employees. Our full disclosures are available here. Definitions of common statistics used in our analysis are available here (towards the bottom).
Join thousands of other readers and subscribe to our blog.