- Mark Kritzman and Yuanzhen Li
- Financial Analyst Journal, 2010
- A version of this paper can be found here
- Want to read our summaries of academic finance papers? Check out our Academic Research Insight category
What are the Research Questions
When hunting for diversity, the typical investor considers only average correlations. However, when measuring an asset’s diversification benefits utilizing average correlations tend to mislead investors. For example, when both U.S. and non-U.S. equities produce returns greater than one standard deviation above their means (ie when times are good), their correlation equals –17 percent; but when both markets produce returns more than one standard deviation below their means (ie when things are bad and you want diversification), their correlation rises to +76 percent (based on monthly returns from 1970 to 2008). So on utilizing average correlations, it appears as though non-U.S. equities produce the diversification benefit investors are looking for. It is this period of financial turbulence, the periods in which investors are most interested in diversification, that the authors investigate specifically.
- First, the authors identify the empirical features of financial turbulence.
- Secondly, they investigate what the possible applications are for this measure?
What are the Academic Insights?
By utilizing a measure of financial turbulence,(1) which was originally developed by Mahalanobis (1927, 1936) to analyze characteristics of human skulls(2), the authors find:
- There are two particular features that are interesting:
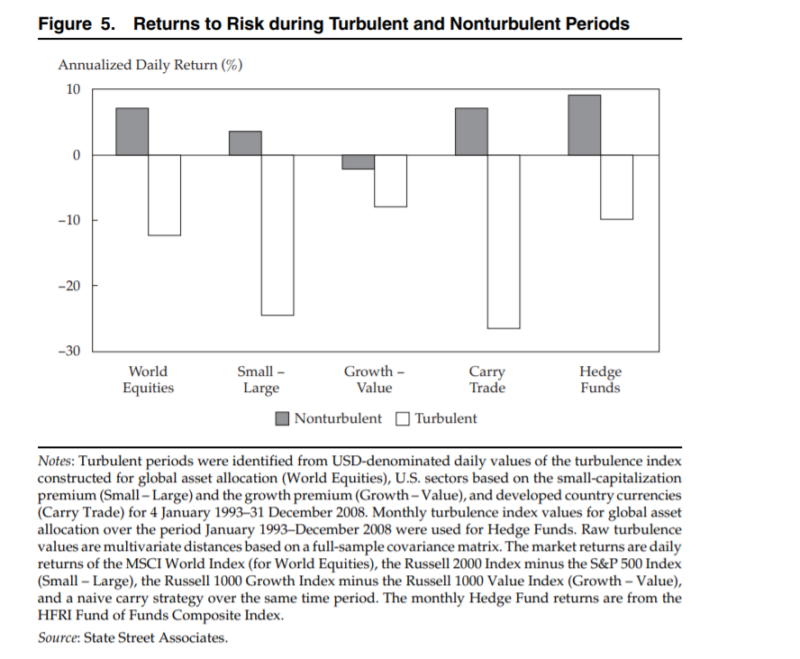
- Returns to risk assets are substantially lower during turbulent periods than during non-turbulent periods, irrespective of the source of turbulence.
- Financial turbulence is highly persistent. Although we may not be able to anticipate the initial onset of financial turbulence, once it begins, it usually continues for a period of weeks as the markets digest it and react to the events causing the turbulence.
- The authors show a couple of possible practical applications:
- Stress Test Portfolios: Investors often use value at risk (VaR) to measure a portfolio’s exposure to loss but the conventional approach for measuring VaR uses the full-sample covariance matrix to compute the portfolio’s standard deviation. The authors suggest measuring exposure to losses more reliably by estimating covariance from the turbulent subperiods when losses are more likely to occur.
- Build Turbulence Resistant portfolios: Use modified mean-variance optimization by blending the turbulent subsample covariance with the full-sample covariances in proportion to their sample sizes
- Enhance the performance of certain risky strategies by using turbulence as a filter for scaling exposure to risk.
Why does it matter?
This study shows that a mathematically derived measure of financial turbulence, which measures the statistical unusualness of a set of returns given their historical pattern of behavior, coincides with well known episodes of market turbulence. This measure of financial turbulence can be applied in a variety of useful ways.
The Most Important Chart from the Paper
Abstract
Based on a methodology introduced in 1927 to analyze human skulls and later applied to turbulence in financial markets, this study shows how to use a statistically derived measure of financial turbulence to measure and manage risk and to improve investment performance.
References[+]
| ↑1 | The authors define financial turbulence as a condition in which asset prices, given their historical patterns of behavior, behave in an uncharacteristic fashion, including extreme price moves, decoupling of correlated assets, and convergence of uncorrelated assets. Financial turbulence often coincides with excessive risk aversion, illiquidity, and devaluation of risky assets. |
|---|---|
| ↑2 | for additional details see Chow et al. (1999) |
About the Author: Wesley Gray, PhD
—
Important Disclosures
For informational and educational purposes only and should not be construed as specific investment, accounting, legal, or tax advice. Certain information is deemed to be reliable, but its accuracy and completeness cannot be guaranteed. Third party information may become outdated or otherwise superseded without notice. Neither the Securities and Exchange Commission (SEC) nor any other federal or state agency has approved, determined the accuracy, or confirmed the adequacy of this article.
The views and opinions expressed herein are those of the author and do not necessarily reflect the views of Alpha Architect, its affiliates or its employees. Our full disclosures are available here. Definitions of common statistics used in our analysis are available here (towards the bottom).
Join thousands of other readers and subscribe to our blog.