My October 29, 2020, article for Alpha Architect examined the research on the profitability factor. I then reviewed the findings of the June 2020 study “On the Conjoint Nature of Value and Profitability,” which analyzed how combining the profitability factor with the value factor— tilting the portfolio’s exposure to the two factors—impacted the risk and return of a long-only U.S. portfolio. The authors, Sunil Wahal and Eduardo Repetto, demonstrated that combining the two resulted in more efficient portfolios.
In their November 2020 study, “The Joint Distribution of Value and Profitability: International Evidence,” Wahal and Repetto expanded their research to include international tests of the joint distribution of value and profitability. They noted: “International data provide confidence with respect to the economic underpinnings of the strategies, potentially reinforcing the robustness of the empirical evidence. This out-of-sample testing avoids data snooping and confirmation biases that are pernicious for both asset pricing tests and for investors.” They formed value and profitability portfolios independently and examined the return series generated using a joint ranking from both metrics.
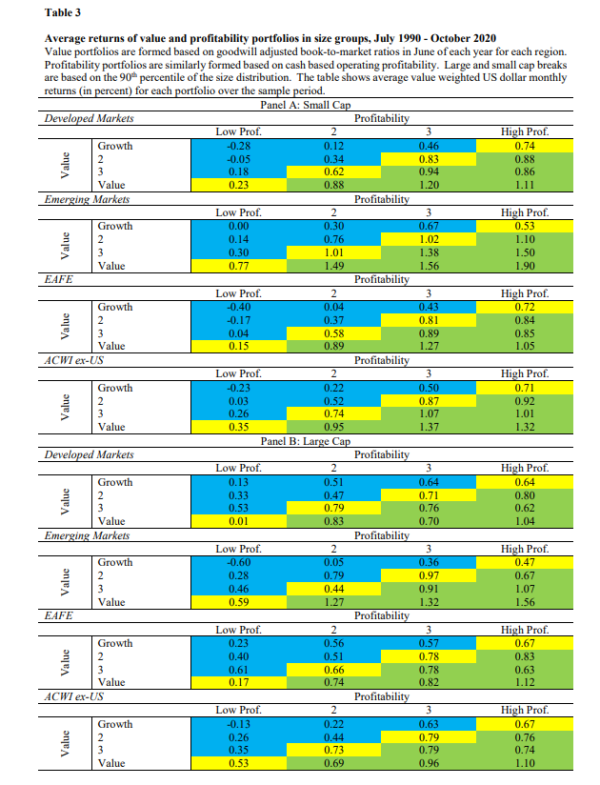
The building block of their analysis consisted of 4-by-4 grids of value and profitability. They measured book-to-market ratios in June of each year, adjusting book values for goodwill. They also measured profitability using cash-based operating profitability, cleaning out operating profitability from accruals using consecutive balance sheet information, and scaling by book equity. Size breaks (for separating large and small-cap stocks) were based on the 90th percentile of the distribution. They did note that in tests of the robustness of their findings, using unadjusted book value, operating profitability, or cash-based operating profitability measured using cash flow statements did not change their inferences. Portfolios were rebalanced each year. Their data sample covered the period July 1990 to October 2020 and 49 countries. Following is a summary of their findings:
- There was a clear relation between returns and value/profitability portfolios.
- In each value portfolio, returns increased steadily with profitability.
- In each profitability portfolio, returns increased with value.
- Importantly, the relation between the joint distribution of value and profitability was monotonic. This was true in both developed markets and emerging markets.
- The return differences were present in developed markets (ex-U.S.), emerging markets, subsets and combinations thereof (EAFE, ACWI ex-U.S.) as well as in large and small stocks—the returns were not driven by un-investable microcap stocks.
- In developed markets, the low profitability growth portfolio earned -0.05 percent per month, whereas the value and high profitability portfolio earned 1.12 percent per month, a spread of 1.17 percentage points per month. In emerging markets, EAFE and ACWI ex-U.S. portfolios, the equivalent spreads were 2.20, 1.33 and 1.43 percentage points per month, respectively.
- In every region studied, the average return on the small stock component portfolio was bigger than the equivalent large stock component portfolio. However, the spread in returns in large stocks generated by the intersection of value and profitability was economically large.
- Despite the differences in average returns, the standard deviations of returns of the high expected return groups were not substantially higher, and in some cases lower.
- The Sharpe ratios of combined value and profitability were higher than those of pure value or pure profitability strategies in every country combination they examined.
Their findings led Wahal and Repetto to conclude:
“When viewed in combination with similar such evidence from the US, the data suggest important benefits to targeting value and profitability jointly rather than piecemeal.”
They added:
“The observability of similar results in other markets suggests that the underlying economic intuition behind these strategies is both sound and agnostic to markets.”
They also noted that the “high expected return” portfolios can comprise as much as 25 percent of the aggregate market capitalization—portfolio capacity is quite high, particularly relative to value or profitability independently.
The research demonstrating the benefits of combining value and profitability (as well as combining value and momentum, or all three) has led fund families such as AQR, Alpha Architect, Avantis, BlackRock and Dimensional to incorporate the strategy into portfolio construction design.
Disclosures
Indices are not available for direct investment. Their performance does not reflect the expenses associated with the management of an actual portfolio nor do indices represent results of actual trading. Information from sources deemed reliable, but its accuracy cannot be guaranteed.
By clicking on any of the links above, you acknowledge that they are solely for your convenience, and do not necessarily imply any affiliations, sponsorships, endorsements or representations whatsoever by us regarding third-party websites. We are not responsible for the content, availability or privacy policies of these sites, and shall not be responsible or liable for any information, opinions, advice, products or services available on or through them.
This article is for general information only and is not intended to serve as specific financial, accounting or tax advice. IRN-20-1567
© 2020 Buckingham Strategic Wealth
About the Author: Larry Swedroe
—
Important Disclosures
For informational and educational purposes only and should not be construed as specific investment, accounting, legal, or tax advice. Certain information is deemed to be reliable, but its accuracy and completeness cannot be guaranteed. Third party information may become outdated or otherwise superseded without notice. Neither the Securities and Exchange Commission (SEC) nor any other federal or state agency has approved, determined the accuracy, or confirmed the adequacy of this article.
The views and opinions expressed herein are those of the author and do not necessarily reflect the views of Alpha Architect, its affiliates or its employees. Our full disclosures are available here. Definitions of common statistics used in our analysis are available here (towards the bottom).
Join thousands of other readers and subscribe to our blog.