Predictable Price Pressure
- Sam Hartzmark and David Solomon
- working paper
- A version of this paper can be found here
- Want to read our summaries of academic finance papers? Check out our Academic Research Insight category
What are the Research Questions?
Traditional finance theory suggests that stocks prices always reflect their fair market values based on publicly available information. Or in academic parlance, the “semi-strong” form efficient markets hypothesis serves as the null. What are the implications of this hypothesis? Well, the hypothesis suggests that the only reason a stock price will move is due to a shift in fundamentals (either through a change in expected cash flows or via the discount rate). But what about supply and demand shifts? If there are massive flows into an investment category (e.g., ESG, junior gold miners, market-cap-based passive indexes, etc.) that aren’t tied to fundamentals, the EMH theory predicts no price change. The alternative hypothesis, let’s call it the ‘price pressure hypothesis,’ would suggest that prices will change because providing liquidity and arbitrage capital is costly.
Great, we have some competing hypotheses, let’s go test these ideas with some data. But here is where things get tricky. How does a researcher differentiate between the EMH and price pressure theories? In almost all empirical settings it is almost impossible to know if a movement in a price is NOT related to fundamentals. For example, MSFT goes up 5% today and we know a mutual fund that has a 20% position in MSFT received $10B in flows, yesterday. Smells like price pressure, eh? Well, not exactly. What if the flows are driven by a change in fundamentals? What about other news in the environment? Things get tricky real quick. In short, empirically differentiating between the EMH and price pressure hypotheses is next to impossible.
Fortunately, in this paper, the authors identify a clever empirical setting and use dividend payments as a way to identify if fund flows can affect prices, independent of changes in fundamentals. Dividends are interesting because of the following:
- Payments are known aorund 40 days prior and typically don’t convey new information
- Payments are highly predictible in timing and amount
- Payments are typically tied to large and liquid securities
By looking at dividend payments, the authors explore the following question:
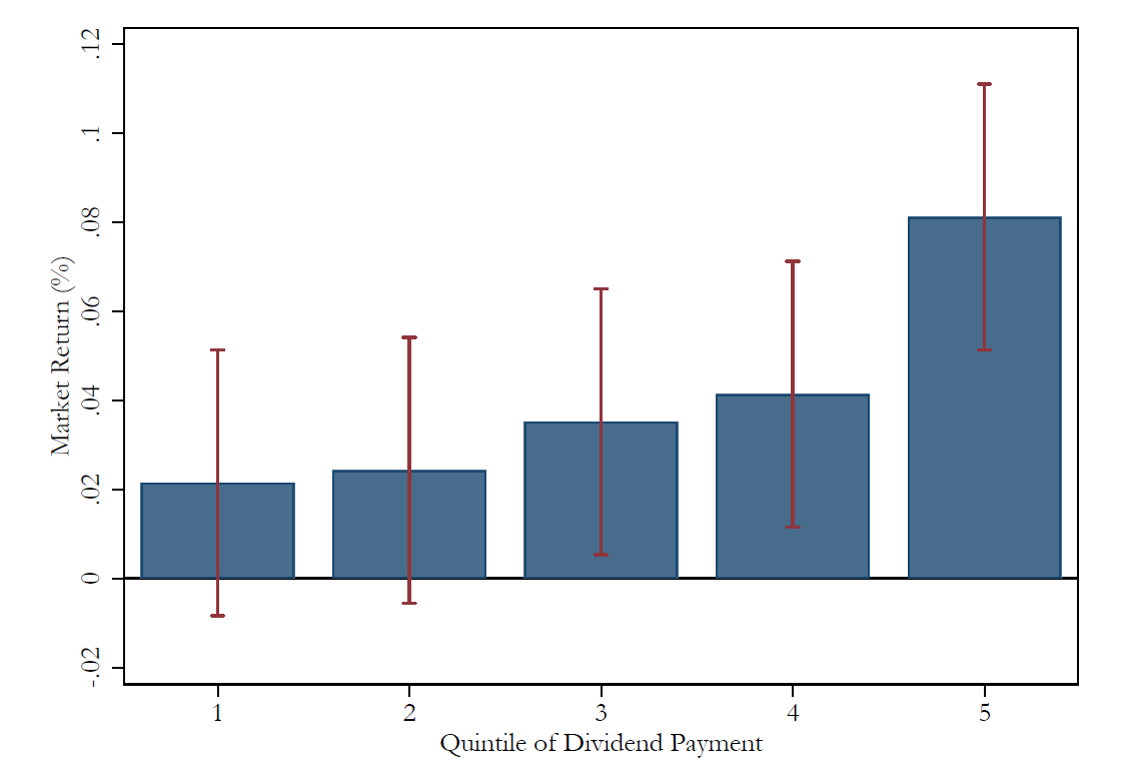
- Are daily market returns higher when dividend payments are higher?
- Does the effect vary by quarter? i.e., 1st quarter vs 4th quarter?
What are the Academic Insights?
- The market moves higher when dividends are paid. Market returns are 4x higher when dividend-payments are the highest. The results hold internationally as well. Some specific stats: market returns are 13bps higher on the top 5 dividend-payment days and 5bps higher on the top 50 dividend-paying days.
- The largest price pressure effects are in the first quarter of the year, when the probability of an asset manager reinvesting is highest. In contrast, the effect is muted in the fourth quarter, when the probability of reinvestment is lowest (managers are using cash to pay off investors).
Why Does it Matter?
This paper is one of the first to identify that price pressure can have macro effects on the market and the paper lends support to an emerging theory coined the ‘inelastic market hypothesis’, which suggests that fund flows matter — a lot — in financial markets. Many financial commentators have suggested that flows can affect prices — even when the flows are unrelated to fundamentals, but these pundits have never been taken seriously. Now we have more robust evidence that the price pressure hypothesis might be more than just a hypothesis, it could actually reflect reality. As investors, understanding how flows affect prices is of great importance to tactical models.
The Most Important Chart from the Paper
Abstract
We demonstrate that predictable uninformed cash flows forecast market and individual stock returns. Buying pressure from dividend payments (announced weeks prior) predicts higher value-weighted market returns, with the top quintile of payment days four times higher than the lowest. This effect holds internationally, varies with reinvestment intensity, and increases with high VIX. High stock expense firms have lower returns from selling pressure when blackout periods lift, by 117 b.p. in four days. We estimate market-level price multipliers of 1.5 to 2.3. These results suggest price pressure is a widespread result of flows, rather than an anomaly.
About the Author: Wesley Gray, PhD
—
Important Disclosures
For informational and educational purposes only and should not be construed as specific investment, accounting, legal, or tax advice. Certain information is deemed to be reliable, but its accuracy and completeness cannot be guaranteed. Third party information may become outdated or otherwise superseded without notice. Neither the Securities and Exchange Commission (SEC) nor any other federal or state agency has approved, determined the accuracy, or confirmed the adequacy of this article.
The views and opinions expressed herein are those of the author and do not necessarily reflect the views of Alpha Architect, its affiliates or its employees. Our full disclosures are available here. Definitions of common statistics used in our analysis are available here (towards the bottom).
Join thousands of other readers and subscribe to our blog.