In this article, the author examines several important questions related to asynchronous trading, or the variation in trading frequency that occurs when trading stocks or other assets.
- Timo Wiedemann, University of Muenster (Germany)
- The newest version of the paper can be found here.
What are the Research Questions?
Trading is not continuous, leading to asynchronous trading times for different assets. Researchers, however, often assume – when applying leading asset pricing models such as the CAPM – that prices are recorded simultaneously. Not accounting for this circumstance leads to biased risk estimates, such as a stock’s market beta, and possibly false inferences. The author uses intraday information from the TAQ database to find answers to the following questions:
- How large is the bias in beta estimates arising from asynchronous trading in real data?
- What is the functional relationship between a possible measure of asynchronicity and the bias induced?
- Can the bias be quantified historically for a period for which intraday data is missing?
- How can established bias correction methods be adapted to fully mitigate the problem?
- What are the implications for the well-known liquidity premium or the idiosyncratic volatility (IVOL) anomaly?
What are the Academic Insights?
The author shows that:
- Asynchronous trading biases standard measures of risk: using real transaction data, the author shows both in a simulation and empirically that this bias easily amounts to 30% in a more recent sample.
- The relative bias in beta increases linearly in the stock’s time-to-close (TTC), which is the time of the stock’s last trade relative to the end of the trading day and hence a measure of asynchronicity.
- Turnover is an imperfect proxy for a stock’s TTC and hence for the expected bias induced by asynchronous trading. Analyzing the bias for the least traded stocks on historical data, it can be quantified to exceed 50% on average between 1963 and 1992.
- The approach of Dimson (1979) is meant to mitigate the bias induced by including lagged factor returns in regressions. The author shows that the approach can fully mitigate the bias when 11 lags are used. The approach commonly used in the literature leaves a large part of the bias unaccounted for.
- The effects have important implications for empirical asset pricing. When accounting for several kinds of microstructure noise, the conditional CAPM is able to explain the liquidity premium. Similarly, the bias in beta translates into a bias of the standard measures of IVOL. This is in line with several studies arguing for the IVOL anomaly to be a mechanical artifact.
Why Does It Matter?
The effect of asynchronous trading is well understood theoretically, and bias correction methods have been proposed. Still, those methods are inconsistently used in the literature, with the issue being exacerbated by an increasing number of studies using daily return data without any correction. The results show that the literature – while being to some extent aware of the potential issue – does not fully account for the bias induced by asynchronous trading. This means that beta, a popular measure of systematic risk associated with a stock, may largely be underestimated, which in turn may have important implications for portfolio managers aiming to achieve a pre-specified target beta. It also has important implications for empirical asset pricing. The author shows how the bias in beta translates into a bias of risk-adjusted returns or a measure of a stock’s idiosyncratic volatility. Consequently, the findings of this paper may change the statistical significance of previous findings.
An Important Chart from the Paper
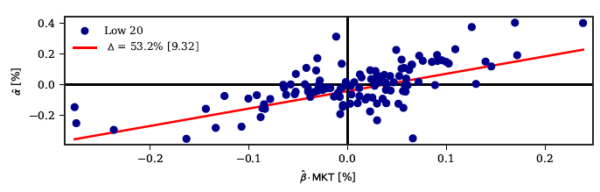
The graph proves the existence of the bias ∆ in beta for the 20% least traded stocks in a historical data set from July 1963 until December 1992. The highly statistically significant and positive slope in the graph implies that estimated betas are about 50% too small. Further analysis shows that the bias correction method of Dimson (1979) – in the way it is used in the literature – cannot eliminate the bias.
Figure 1: Historical Beta Estimation Error for the 20% Least Traded Stocks
The results are hypothetical results and are NOT an indicator of future results and do NOT represent returns that any investor actually attained. Indexes are unmanaged and do not reflect management or trading fees, and one cannot invest directly in an index.
Abstract on Asynchronous Trading
Trading is not continuous, leading to asynchronous trading times for different assets. This paper analyses the effect of asynchronous trading on an asset’s beta and evaluates its implication for the asset pricing literature. It shows that estimates are heavily downward-biased, with estimated betas that can be up to 50% too small for an early data period. It further shows that the explanatory power of the conditional CAPM can be enhanced in the sense that it can fully explain the liquidity premium. I argue that the asset pricing literature does not fully account for the bias induced by asynchronous trading.
About the Author: Timo Wiedemann
—
Important Disclosures
For informational and educational purposes only and should not be construed as specific investment, accounting, legal, or tax advice. Certain information is deemed to be reliable, but its accuracy and completeness cannot be guaranteed. Third party information may become outdated or otherwise superseded without notice. Neither the Securities and Exchange Commission (SEC) nor any other federal or state agency has approved, determined the accuracy, or confirmed the adequacy of this article.
The views and opinions expressed herein are those of the author and do not necessarily reflect the views of Alpha Architect, its affiliates or its employees. Our full disclosures are available here. Definitions of common statistics used in our analysis are available here (towards the bottom).
Join thousands of other readers and subscribe to our blog.