This article discusses the academic research about the Momentum Gap and the role that its predictive potential may have in reducing momentum crashes, hence possibly improving performance. In our book “Your Complete Guide to Factor-Based Investing,” Andrew Berkin and I presented the evidence demonstrating that momentum, both cross-sectional (CSMOM) and time-series (TSMOM), has provided a premium that has been found to be persistent across time and economic regimes, pervasive around the globe and across sectors and asset classes (stocks, bonds, commodities, and currencies), robust to various definitions, and survives transaction costs. And with equities, compared to the market, value, size, profitability and quality factors, it has delivered the highest premium. However, equity momentum has also had the worst crashes, making the strategy unappealing to investors with strong risk aversion.
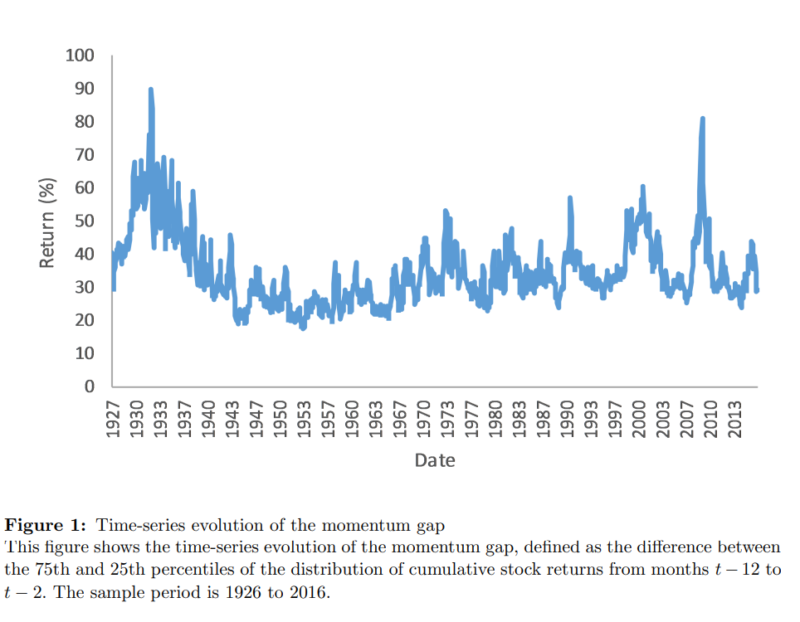
Simon Huang contributes to the momentum literature with his study “The Momentum Gap and Return Predictability,” published in the July 2022 issue of The Review of Financial Studies, in which he examined the informational value of what he called the “momentum gap” (MG)—the difference between 75th and 25th percentiles of the distribution of cumulative stock returns from month t − 12 to t − 2. Huang also utilized the 90th and 10th percentiles (MGidr). As an example, if you sort stock returns in a particular year into quartiles based on momentum and find that at the 75th percentile these relatively high momentum stocks returned 12 percent, while at the 25th percentile these relatively lower momentum stocks returned 10 percent, the momentum gap would be 2 percent.
Huang’s main sample is from the Center for Research in Security Prices (CRSP) and covered U.S. stocks over the period 1926-2016. He excluded stocks with a price below $1. At the beginning of each month t, stocks were sorted based on their cumulative returns from months t − 12 to t − 2 (the formation period) using NYSE breakpoints. Returns were controlled for exposure to the Fama-French three factors (market beta, size and value).
Following is a summary of his findings:
- MG and MGidr were highly correlated.
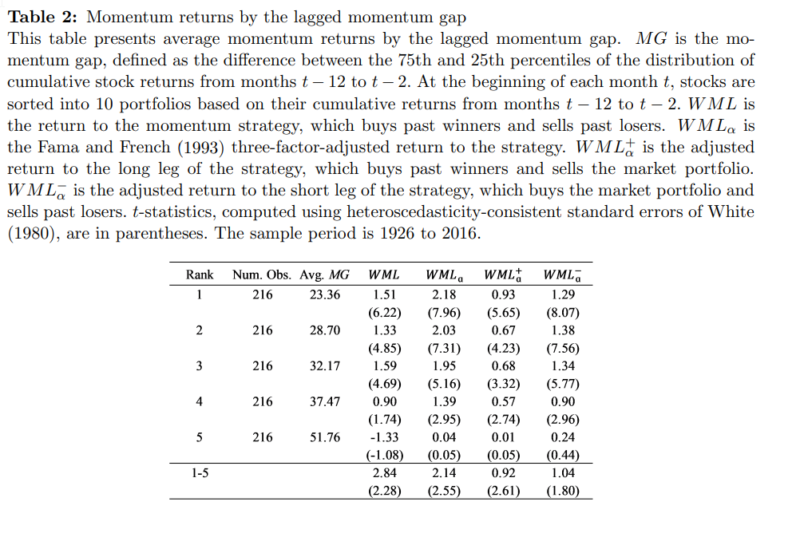
- MG was negatively related to momentum returns—if the lagged MG gap was small (large), subsequent long/short momentum returns were high (low).
MG displayed substantial time variation: Its mean over the period 1927-1940 was 48.42 percent, almost twice as large as its mean of 26.21 percent over the period 1941-1960. However, it did not seem to have a clear trend, with a peak in 2009.
The average adjusted return to the baseline momentum strategy varied monotonically from a highly significant (t-stat = 7.96) 2.18 percent per month when the lagged MG gap was small to just 0.04 percent per month (t-stat = 0.05) when the lagged momentum gap was large.
- The predictive power of Momentum Gap remained economically and statistically significant after controlling for market return, market volatility, and market illiquidity.
- A one-standard deviation increase in MG was associated with a 1.25 percent decrease in the monthly momentum returns. This predictability extended up to five years for static momentum portfolios, consistent with time-varying investor biases.
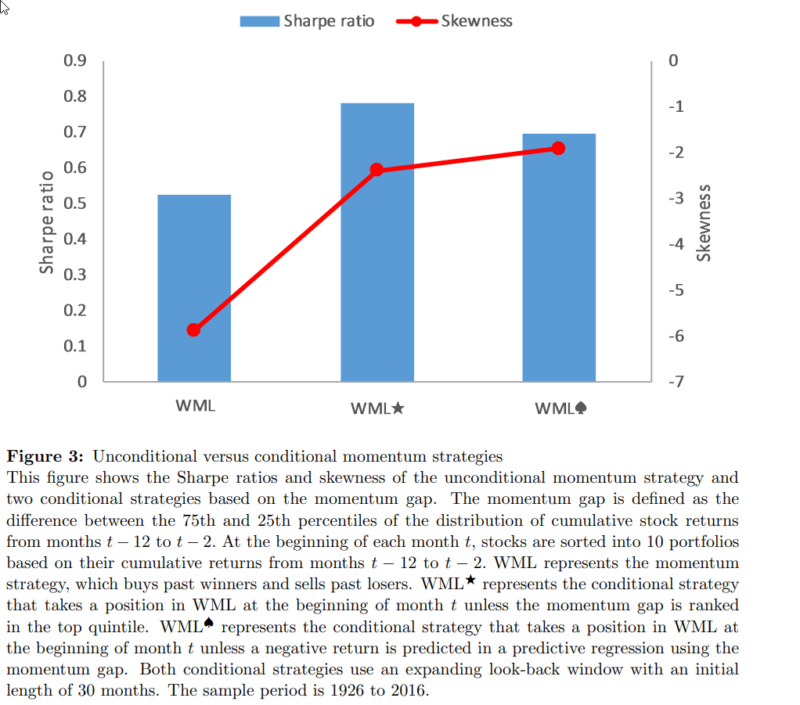
- Conditional momentum strategies using MG produced substantially higher Sharpe ratios and lower skewness and kurtosis than unconditional strategies. Following the simple real-time strategy of investing in momentum only when the momentum gap was below the 80th percentile delivered a Sharpe ratio of 0.78 and a skewness of -2.4.
MG demonstrated significant predictive power for both the long and short legs of the momentum trade, ruling out the possibility that the results were driven by the infrequent yet large-scale reversals of past losers.
Momentum Gap was the only variable that significantly predicted momentum crashes, as peaks in MG tended to occur around them. Thus, a conditional MG strategy could reduce the risk of momentum crashes, which have occurred in reversals from bear markets when the momentum portfolio displayed a negative market beta and momentum volatility was high.
In a test of pervasiveness, over the period July 1989-August 2013, the relationship between MG and future momentum profits was negative in 20 of 21 developed markets and was statistically significant in 15. The relation was not significantly positive in any country.
The predictive power of the momentum gap was robust across time and significant in both subperiods (1927-1971 and 1972-2016), each spanning more than 40 years.
There was no evidence that MG forecasted intermediate to long-horizon returns to the monthly rebalanced momentum strategy—suggesting that MG is associated with stock-level mispricing rather than the crowdedness of the momentum trade.
There was no significant difference between MG’s predictive power across the dimensions of size, illiquidity, idiosyncratic volatility, and institutional ownership—inconsistent with the idea that the predictive power of MG is due to its association with arbitrage forces.
Consistent with an underreaction interpretation of momentum, when MG was small the momentum portfolio earned positive intermediate-horizon profits that did not reverse over long horizons. On the other hand, conditional on the momentum gap being large, the momentum portfolio experienced negative abnormal returns over both intermediate and long horizons, suggesting overreaction during the portfolio formation period. Thus, whether the momentum portfolio will exhibit price continuation or reversals depends on the relative value of the momentum gap.
His findings led Huang to conclude that the formation period return difference between past winners and losers [MG] negatively predicts momentum profits, with the predictive power of the momentum gap remaining significant after controlling for existing predictor variables, including the market return and market illiquidity. In an attempt to explain the negative relation between the momentum gap and subsequent momentum profits, Huang hypothesized that his results were loosely consistent with the following behaviorally motivated story: It could reflect the market’s reaction to certain fundamental news. When MG was small, it could indicate that the market underreacted due to conservatism or inattention, and when it was large, it could signal that the market had overreacted due to overconfidence. In both cases, the momentum gap would negatively forecast profits of the winner-minus-loser portfolio as prices reverted to their fundamentals.
Investor Takeaways
Huang’s findings are of interest, as he appears to have found a simple heuristic that could add value to a momentum strategy by providing a timing mechanism based on the Momentum Gap and significantly reducing the risk of momentum crashes. It’s worth noting that prior research, including the 2014 study “Momentum Crashes,” the 2017 study “A Century of Evidence on Trend-Following Investing,” the 2018 study “The Impact of Volatility Targeting,” the 2018 study “Portfolio Management of Commodity Trading Advisors with Volatility Targeting,” and the 2020 studies “Conditional Volatility Targeting” and “Understanding Volatility-Managed Portfolios,” has found that momentum strategies have benefited from scaling volatility through reducing crash risk. Thus, there is perhaps more than one way to reduce the risk of momentum crashes.
Disclosures
For informational and educational purposes only and should not be construed as specific investment, accounting, legal, or tax advice. Certain information is based upon third party data and may become outdated or otherwise superseded without notice. Third party information is deemed to be reliable, but its accuracy and completeness cannot be guaranteed. By clicking on any of the links above, you acknowledge that they are solely for your convenience, and do not necessarily imply any affiliations, sponsorships, endorsements or representations whatsoever by us regarding third-party websites. We are not responsible for the content, availability or privacy policies of these sites, and shall not be responsible or liable for any information, opinions, advice, products or services available on or through them. The opinions expressed by featured authors are their own and may not accurately reflect those of Buckingham Strategic Wealth® or Buckingham Strategic Partners®, collectively known as Buckingham Wealth Partners. Neither the Securities and Exchange Commission (SEC) nor any other federal or state agency have approved, determined, or confirmed the adequacy of this article. LSR-22-366
About the Author: Larry Swedroe
—
Important Disclosures
For informational and educational purposes only and should not be construed as specific investment, accounting, legal, or tax advice. Certain information is deemed to be reliable, but its accuracy and completeness cannot be guaranteed. Third party information may become outdated or otherwise superseded without notice. Neither the Securities and Exchange Commission (SEC) nor any other federal or state agency has approved, determined the accuracy, or confirmed the adequacy of this article.
The views and opinions expressed herein are those of the author and do not necessarily reflect the views of Alpha Architect, its affiliates or its employees. Our full disclosures are available here. Definitions of common statistics used in our analysis are available here (towards the bottom).
Join thousands of other readers and subscribe to our blog.