In our book “Your Complete Guide to Factor-Based Investing,” Andrew Berkin and I presented the evidence demonstrating that momentum, both cross-sectional (CSMOM) and time-series (TSMOM), has provided a premium that has been found to be persistent across time and economic regimes, pervasive around the globe and across sectors and asset classes (stocks, bonds, commodities, and currencies), robust to various definitions and survives transactions costs. And with equities, compared to the market, value, size, profitability, and quality factors, it has delivered the highest premium. However, equity momentum has also had the worst crashes, making the strategy unappealing to investors with strong risk aversion.
As Maik Dierkes and Jan Krupski, authors of the 2022 study “Isolating Momentum Crashes,” published in the March 2022 issue of the Journal of Empirical Finance, noted:
“While average momentum returns have been high, investors have also experienced huge drawdowns—momentum exhibits both high kurtosis and negative skewness. Since 1926, there have been several momentum crashes that feature short but persistent periods of highly negative returns. From June to August 1932 the momentum portfolio lost about 91%, followed by a second draw-down in April to July 1933. Another prominent crash took place in 2009 when momentum lost more than 73% within a period of three months. In addition to that, there have been several smaller crashes in 1938/1939, 1974/1975, and 2001/2002. While being smaller in size, each of those comprised at least one monthly loss of more than 19%. Therefore, high monthly returns of 1.15% come with a large kurtosis of 16.6 and highly negative skewness of -2.3.”
They added:
“Remarkably, crashes are driven by large gains of previous losers while winners still exhibit modestly positive returns.”
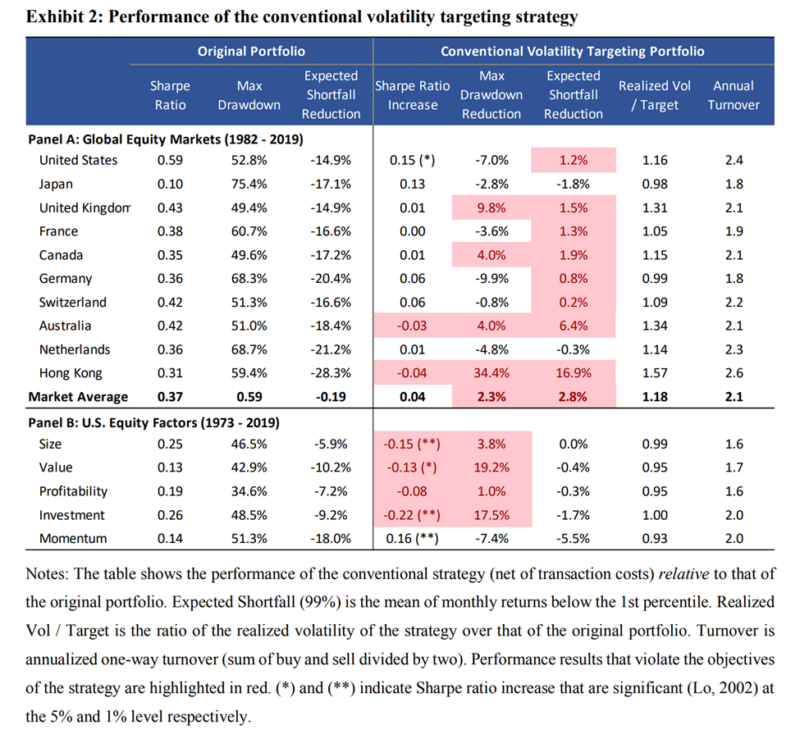
The good news is that researchers have uncovered strategies that have reduced crash risk—crashes are at least partly forecastable, tending to occur in “panic” states following market declines and when market volatility is high, and are contemporaneous with market rebounds. For example, Pedro Barroso and Pedro Santa-Clara, authors of the study “Momentum has its Moments,” published in the April 2015 issue of the Journal of Financial Economics, found that the risk of momentum is highly variable over time and is predictable by its own realized variance and that there is a negative relationship of momentum volatility and subsequent returns—momentum volatility increases in times of momentum crashes. The management of that risk virtually eliminated crashes and nearly doubled the Sharpe ratio of the momentum strategy. Thus, they proposed a strategy of constant volatility targeting (specifically, 12%) to address the issue.
Kent Daniel and Tobias Moskowitz, authors of the study “Momentum Crashes,” published in the December 2016 issue of the Journal of Financial Economics, covered the period 1927-2013. They improved upon Barroso and Santa-Clara’s constant volatility strategy, building a dynamic momentum strategy that scaled exposure based on forecasts of momentum’s mean and variance. They found:
“Following major market declines, betas for the past-loser decile can rise above 3 and fall below 0.5 for past winners. Hence, when the market rebounds quickly, momentum strategies will crash because they have a conditionally large negative beta.”
They also found that…
“most of the up- versus down-beta asymmetry in bear markets is driven by the past losers.” Thus, long-only momentum strategies are not subject to such deep crashes. They then demonstrated that “an implementable dynamic momentum strategy based on forecasts of momentum’s mean and variance approximately doubles the alpha and Sharpe ratio of a static momentum strategy and is not explained by other factors. These results are robust across multiple time periods, international equity markets, and other asset classes.”
Other studies, including the 2017 study “A Century of Evidence on Trend-Following Investing,” the 2018 study “The Impact of Volatility Targeting” and the 2019 study “Portfolio Management of Commodity Trading Advisors With Volatility Targeting,” have also found that momentum strategies have benefited from scaling volatility.
Extreme Volatility States
Dion Bongaerts, Xiaowei Kang, and Mathijs van Dijk, authors of the 2020 study “Conditional Volatility Targeting” found that scaling strategies could be improved upon by adjusting risk exposures conditional on (extreme) volatility states—their strategy reduces risk exposures during high volatility states, increases risk exposures during low volatility states, and maintains an unscaled exposure otherwise. They found that not only did the conditional strategy significantly reduce drawdowns and tail risks across all major equity markets and momentum factors but also significantly reduced turnover. Their findings were consistent with those of Georg Cejnek and Florian Mair, authors of the 2020 study “Understanding Volatility-Managed Portfolios,” who found that while a simple linear regression showed no clear relationship between outperformance and volatility, once volatility exceeded a certain threshold, the volatility-managed portfolio always outperformed the unmanaged strategy.
The results are hypothetical results and are NOT an indicator of future results and do NOT represent returns that any investor actually attained. Indexes are unmanaged, do not reflect management or trading fees, and one cannot invest directly in an index.
Motivated by the prior research findings, Dierkes and Krupski developed a crash indicator (CI) strategy “which considers both systematic and momentum-specific risk and improves existing risk management approaches.” Their data sample covered the period September 1928-May 2020. They proposed an implementable trading strategy based on their crash indicator and a constant scaling approach. In momentum bull markets, the strategy targeted constant volatility but replaced the volatility of momentum returns by the variance. In crash periods the weight in momentum was reversed—the strategy invested in previous losers and short-sold winners. Thus, the crash indicator not only mitigated momentum crashes but also benefited from them. They proposed three feasible crash indicators:
- A bear market indicator that equaled one if the two-year market return preceding the start of month ???? was negative and was zero otherwise.
- Because momentum crashes occur in reversals, a rebound that equaled zero unless bear markets displayed positive one-month returns.
- A crash indicator was one if a rebound took place and momentum beta was negative.
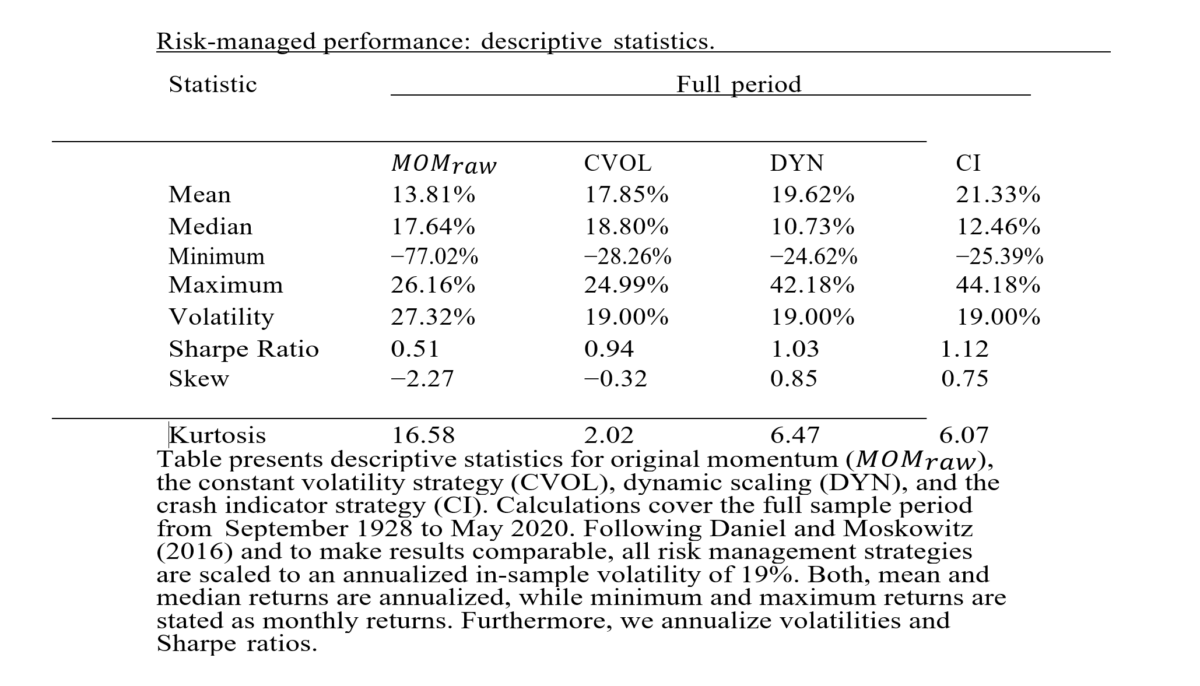
Following Daniel and Moskowitz, Dierkes and Krupski scaled all strategies to have 19% in-sample annualized volatility over the full sample period from September 1928 to May 2020. Following is a summary of their key findings:
- The three indicators all displayed significantly lower returns in periods defined as a crash, with the crash indicator showing the highest and most significant absolute difference in means—producing average returns of -3.63% when a crash was indicated, while the mean of non-crash periods equaled 1.49%.
- A combination of market risk and momentum-specific risk improved crash predictability.
- All three risk management strategies successfully reduced extreme losses—while original momentum exhibited monthly crashes of up to 77%, risk-managed crashes reduced it to about 28% (conditional volatility, CVOL), 25% (dynamic scaling, DYN), and 25% (crash indicator, CI), respectively. Annualized mean returns of CI (21.3%) exceeded those of original momentum (13.8%) by almost 55%, while CVOL and DYN were outperformed by 19.5% and 9%, respectively.
- A decrease of beta by one unit increased contemporaneous (future) momentum volatility by an economically and statistically significant 7.6 (7.2) percentage points.
- Beta was negative in crash periods (for example, 2009), and it was also negative prior to crashes when momentum exhibited exceptionally large returns (for example, 2008). Thus, despite providing some information, beta alone does not avoid momentum crashes.
- An ex-ante crash indicator based on systematic risk measures largely separated momentum crashes from momentum bull markets.
- With a Sharpe ratio of 1.12, CI was superior to both constant volatility (0.94) and dynamic volatility (1.03) strategies.
- CVOL and DYN were subsumed by the CI strategy, while CI’s alpha remained significant at the 1% level even after adjusting for CVOL and DYN simultaneously.
- CI outperformed CVOL and DYN strategies in major crash periods.
- CI consistently provided superior returns in shorter periods of time. DYN was outperformed in all decades and in 90% of five-year periods, while CVOL returns were exceeded in seven out of nine decades and in 75% of rolling windows.
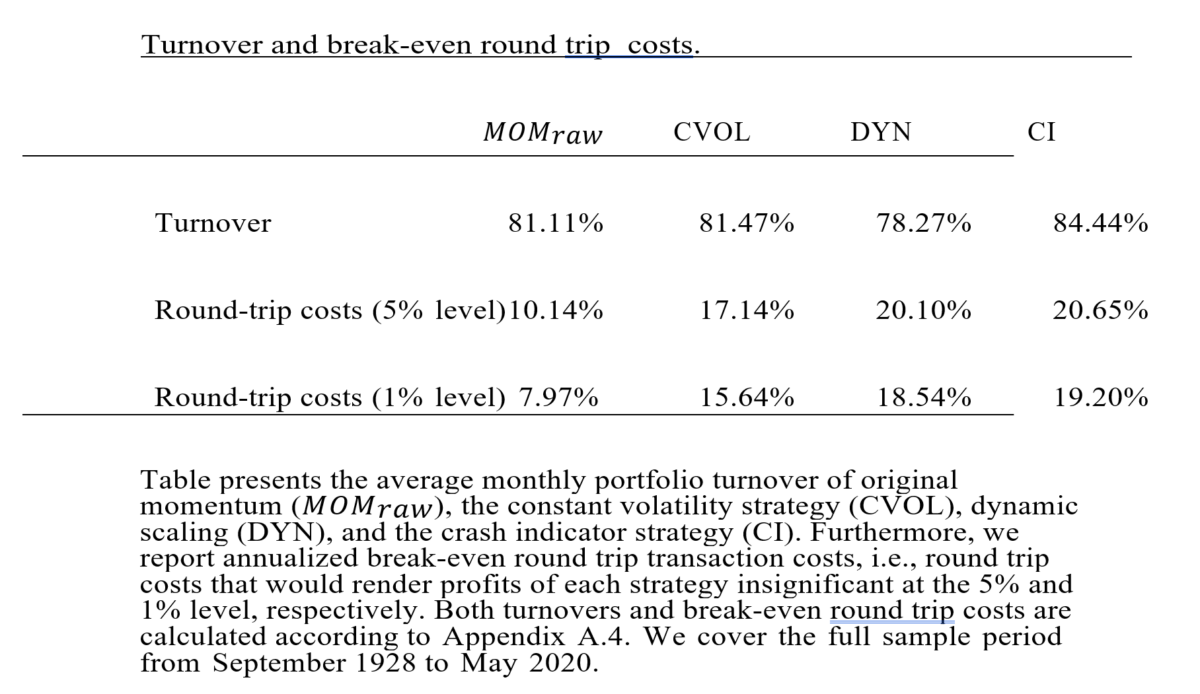
- The three strategies survived reasonable estimates of transaction costs—breakeven turnover costs exceeded 15%.
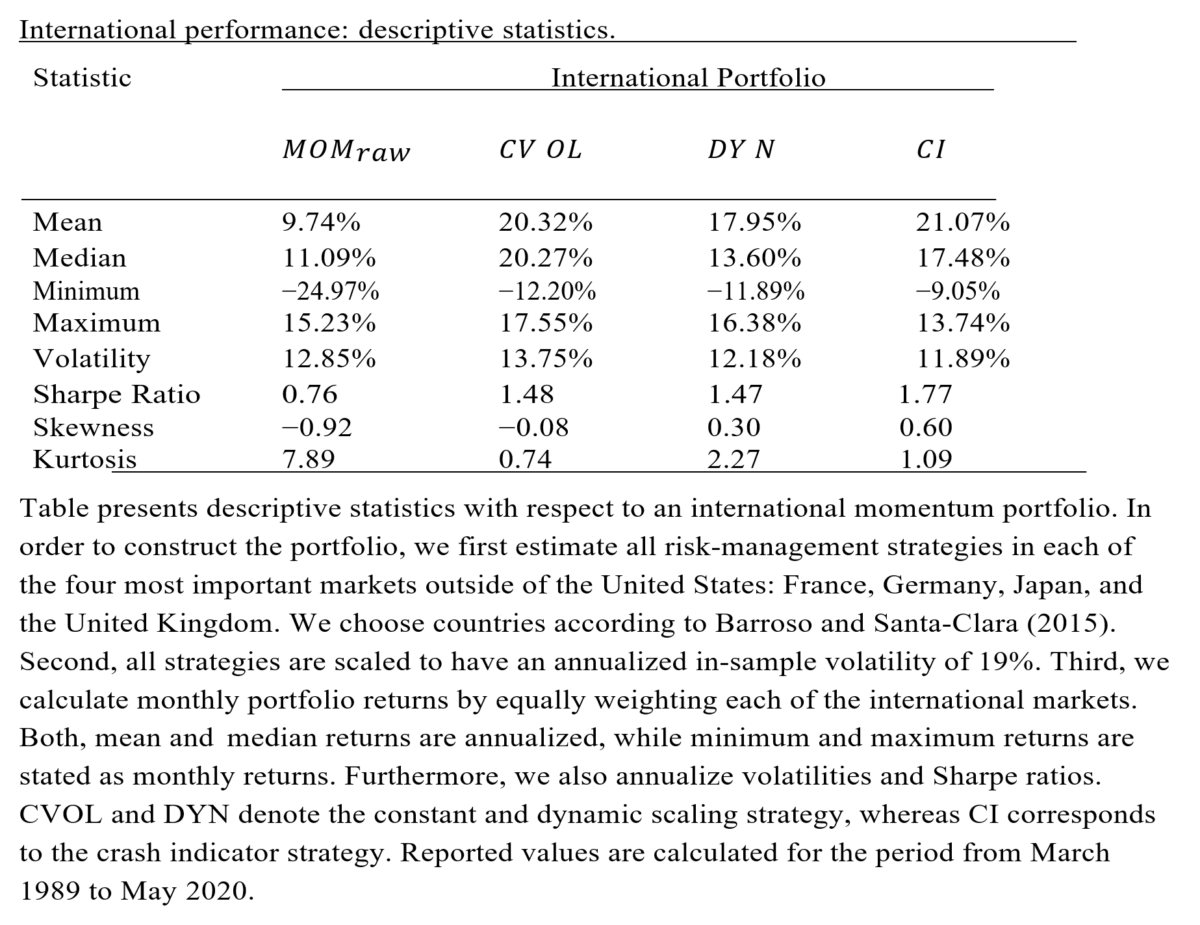
- In robustness tests spanning January 1987-May 2020, CI outperformed in France, Germany, Japan, and the United Kingdom, and globally. The global ex-U.S. Sharpe ratio of CI (1.77) exceeded both CVOL (1.48) and DYN (1.47).
Their findings led Dierkes and Krupski to conclude that the benefits of risk management strategies tend to be reaped precisely when marginal utility is highest—during crash periods. In addition, they noted:
“The crash indicator strategy particularly mitigates crash risk, yet keeping momentum’s upside potential alive.”
Investor Takeaways
The empirical research demonstrates that, on average, investing in previous winners and short-selling previous losers offers highly significant returns that cannot be explained by other common risk factors. However, momentum also displays huge tail risk, as there are short but persistent periods of highly negative returns. Crashes particularly occur in reversals from bear markets when the momentum portfolio displays a negative market beta and momentum volatility is high.
Dierkes and Krupski showed that a crash indicator based on systematic risk measures isolates momentum crashes from momentum bull markets and that the predictive power is enhanced by combining systematic (measured by the crash indicator) and momentum-specific risk (measured by momentum volatility).
Important Disclosures
For informational and educational purposes only and should not be construed as specific investment, accounting, legal, or tax advice. Mentions of specific securities should not be construed as a recommendation and are for informational purposes only. Certain information is based upon third party sources which may become outdated or otherwise superseded without notice. Third party information is deemed to be reliable, but its accuracy and completeness cannot be guaranteed. By clicking on any of the links above, you acknowledge that they are solely for your convenience, and do not necessarily imply any affiliations, sponsorships, endorsements, or representations whatsoever by us regarding third-party websites. We are not responsible for the content, availability, or privacy policies of these sites, and shall not be responsible or liable for any information, opinions, advice, products, or services available on or through them. The opinions expressed by featured authors are their own and may not accurately reflect those of Buckingham Strategic Wealth® or Buckingham Strategic Partners®, collectively Buckingham Wealth Partners. Neither the Securities and Exchange Commission (SEC), nor any other federal or state agency have approved, determined the accuracy, or confirmed the adequacy of this article. LSR-22-310
About the Author: Larry Swedroe
—
Important Disclosures
For informational and educational purposes only and should not be construed as specific investment, accounting, legal, or tax advice. Certain information is deemed to be reliable, but its accuracy and completeness cannot be guaranteed. Third party information may become outdated or otherwise superseded without notice. Neither the Securities and Exchange Commission (SEC) nor any other federal or state agency has approved, determined the accuracy, or confirmed the adequacy of this article.
The views and opinions expressed herein are those of the author and do not necessarily reflect the views of Alpha Architect, its affiliates or its employees. Our full disclosures are available here. Definitions of common statistics used in our analysis are available here (towards the bottom).
Join thousands of other readers and subscribe to our blog.