Cliffwater, with $115 billion in total assets under management ($31B) and advisement ($84B), is a leader in providing proprietary research on private investments and is also the creator of the Cliffwater Direct Lending Index (CDLI) and Cliffwater Direct Lending Senior-Only Index (CDLI-S). In their January 2024 report “Long-Term Private Equity Performance 2000-2023,” Cliffwater found that private equity allocations by state pensions produced a 11.0% net-of-fee annualized return over the 23-year period ending June 30, 2023. Over the same period the CRSP 1-10 Index (U.S. total market) returned 7.2% and the MSCI All Country World ex USA Index returned 4.4%.
Explaining the Outperformance
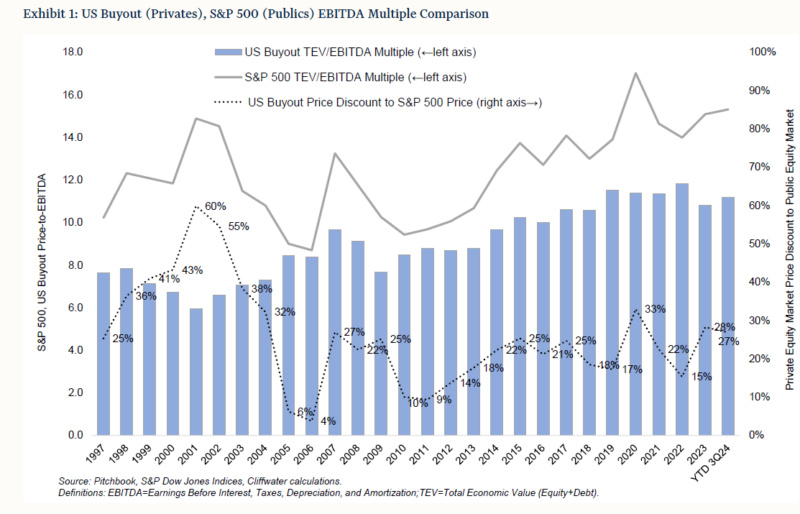
In their November 2024 paper “Purchase Multiples Help Explain Private Equity Excess Returns” showed the EBITDA multiples for private and public equity for the 27-year period from 1997 through the third quarter of 2024. Multiples were measured by the ratio of total economic value (TEV), which includes both equity and debt, to earnings as measured by EBITDA. Pitchbook and S&P Dow Jones Indices are the data sources for US buyouts and the S&P 500, respectively—the proxies for private and public equity. As their chart below demonstrates, valuation multiples are higher for stocks when compared to US buyouts over the entire period.
The results are hypothetical results and are NOT an indicator of future results and do NOT represent returns that any investor actually attained. Indexes are unmanaged and do not reflect management or trading fees, and one cannot invest directly in an index.
Cliffwater found that EBITDA multiples averaged 29% less for US buyouts compared to the S&P 500 Index over the nearly 27-year period. The private equity valuation discount, shown in the dotted line, varied over time. However, it was consistently positive. The discount contributed to private equity excess returns in two ways. First, the 29% discount produced a 3% higher earnings yield on private equity when compared to public stocks. That discount explained about one-half of private equity’s outperformance versus public US stocks. What explained the remaining half?
As private companies grow and are later sold to a strategic buyer or in an IPO, the discount will likely decline (multiples rise). Assuming a complete elimination of the discount, and a 5.5-year average holding period, the elimination would be worth 6% annually to the investor.
The historical 3% contribution to private equity returns from a higher earnings yield plus an assumed 3% contribution (an average of 0% elimination of the discount and a maximum of 6%) from multiple convergence produces a 6% excess return for private equity, gross of fees and expenses.
Based on their experience as an advisor to pension plans investing in private equity, Cliffwater assumed expenses of a 1% management fee, 20% carried interest, and 0.2% in administrative fees. Assuming then a 7% return to public equity, and a 13% gross private equity return (7% plus 6% premium) private equity investors would earn a net return of 9.2% (2.2% excess return) in return for accepting the illiquidity risk of private equity.
Persistence of Performance in Private Equity
Unlike as is the case with public equity, where the evidence is that there is no persistence of outperformance beyond the randomly expected, the empirical research has found that private equity is one asset class where there has been evidence of persistence in performance among both the top and bottom performers. In addition, the research has found that there is a wide dispersion of returns between top and bottom performers. The most common interpretations of this persistence in performance are either skill in distinguishing better investments or the ability to add value post-investment (e.g., providing strategic advice to their portfolio companies or helping recruit talented executives). The research, however, offers another plausible explanation—based on their reputational value, successful firms can charge a premium for their capital.
Reputation and the Cost of Venture Capital (VC)
The empirical research (for example in these articles about venture capital costs and initial success, and persistence) has found that successful VC firms obtain preferential access to investments and better terms, as both entrepreneurs and other VC firms want to partner with them. That enables them to see more deals, particularly in later stages, when it becomes easier to predict which companies might have successful outcomes. It is the access advantage that perpetuates differences in initial success over extended periods of time. That access has enabled high-reputation VCs to acquire startup equity at about a 10%-14% discount, leading to a perpetuation of the advantage. However, these edges applied only to venture capital, not to leveraged buyouts. The bottom line is that investors should be willing to pay somewhat higher expenses for superior persistent past performance.
Accessing Private Equity Through Evergreen Funds
Evergreen funds are a relatively new concept in the private equity (PE) world compared to traditional closed-end funds. They were introduced to address the negatives of the traditional way to invest in private equity which had been in the form of partnerships.
- Investors in the partnerships were limited partners who received Schedule K-1’s at the end of the year. K-1s typically arrive well after the April 15th filing date, requiring extensions. The preparation of the K-1s and the need to file extensions increased the costs of investing in these vehicles.
- Investors in the partnerships make commitments with capital calls coming at unknown dates. The uncertainty of the timing of the calls causes investors to have to hold their remaining commitments in the form of high quality, short-term investments.
- High expense ratio. Management fees were typically 2% plus a carry (performance) fee of 20% once returns exceeded a hurdle rate (such as 7% with catchups for years when performance was below the hurdle). And the expense ratio is charged on the committed amount, not the called amount. Thus, it drags down returns, especially in the early years (the so-called J-curve effect).
- High minimums (such as $1 million or more).
- Long-term commitment.
Evergreen funds have attracted more than $35 billion by addressing these negatives.
- They typically provide 1099s (instead of K-1s) which are delivered on time to meet the April 15, filing date.
- There are no capital calls, eliminating the J-curve effect.
- Minimums tend to much lower, such as $25,000-50,000, democratizing PE.
- Lower expense ratios.
- Periodic liquidity availability.
The two most common structures in this category are tender offer funds and interval funds.
- Interval funds: These funds have predetermined intervals (usually quarterly, semi-annually, or annually) when investors can redeem their shares.
- Tender offer funds: These funds offer investors the opportunity to tender (offer to sell) their shares for redemption at certain points during the year. Unlike interval funds, the timing and amount of share repurchases are at the discretion of the fund manager.
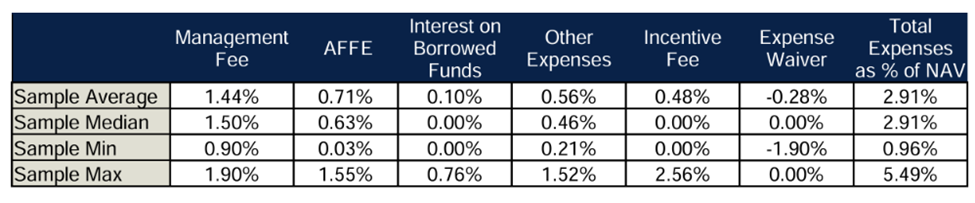
Unlike mutual funds and ETFs which have simple expense ratios, the expense ratios of evergreen funds are more complex, covering several components. Thus, it is important for investors to have a complete understanding of the charges.
- Management fees. Fees charged by the fund manager to cover the costs associated with managing the fund’s investment activities and operations. Some funds charge on net assets. Others charge based on gross assets (includes assets acquired using leverage), which not only increases fees charge, but can also lead to misaligned interests by creating an incentive to take excess risks.
- Acquired fund fees & expenses (AFFE). The management fees and expenses incurred by any underlying funds in which the evergreen fund invests. While investors should not ignore AFFE, neither should they be a disqualifier because funds that invest in secondaries (typically bought at significant discounts) will naturally incur higher AFFE relative to funds that invest only in co-investments which can be made on a no-fee and no-carry basis. It is also important to note that private equity is the one asset class where there is evidence of persistence in performance. In addition, the dispersion between top-quartile and bottom-quartile managers in private equity is meaningfully wider than that of private debt and public equities. Thus, investors should be somewhat less fee sensitive in the pursuit of alpha.
- Interest on borrowed funds. The interest expenses incurred from borrowing activities used for liquidity/liability management or, to a lesser extent, for return enhancement purposes. The cost associated with borrowing depends largely on the amount of leverage used, the types of assets in the fund, and the prevailing interest rate environment. While leverage can enhance returns by amplifying gains, it cuts both ways and can amplify losses as well.
- Incentive fees (carried interest). These fees are typically structured as a share of the profits earned by the fund (e.g., 20% of the profits above a specified hurdle rate).
- Other expenses. This category includes various administrative, custodial, and operational costs such as accounting, legal, compliance services, and transfer agent costs.
- Expense waivers. Can temporarily reduce or eliminate fees, providing short-term relief from high expenses, making the fund more attractive to investors. While beneficial in the short term, waivers are typically temporary and may not reflect the long-term cost structure of the fund.
Analysis of Evergreen PE Fund Fees & Expenses
Using data found in publicly available SEC filings, Cliffwater identified 19 PE-focused tender offer funds and interval funds that were operational at the end of 2023, subject to AUM minimums, and analyzed their expenses. They used the lowest-cost institutional share class for each fund. The following chart illustrates each expense component’s contribution to the overall cost. Note the wide dispersions—the least and most expensive funds have total expenses of 0.96% and 5.49%, respectively.
Evergreen PE Fund Fees and Expenses
A surprising finding was that there was no relationship between fund size and the level of “other expenses” for evergreen PE funds—larger funds should correlate with lower operational/administrative costs as they benefit from economies of scale. They also found that about half the funds charged on a gross asset basis. While the expenses for the evergreen funds are high relative to those of traditional asset classes like public stocks and bonds, compared to the typical “2 and 20” structure that most traditional PE funds charge, the all-in fees for evergreen funds are in most cases meaningfully lower. And, as we saw in Cliffwater’s research, there has been a significant private equity premium that pensions have been able to access.
Multi-manager Funds
Because of the volatility of the asset class, and the wide dispersion of outcomes among fund sponsors, investors should consider multi-manager funds (such as Cliffwater’s CPEFX, with an expense ratio of just 0.96%—the lowest—on net assets), that provide broad diversification across leading PE managers, as well as typically allocating heavily to direct co-investments in their portfolios, which minimizes costs, as well as secondaries (which are typically bought at significant discounts of 8-12% in even good times and much higher discounts during times of volatility).
Larry Swedroe is the author or co-author of 18 books on investing, including his latest, Enrich Your Future: The Keys to Successful Investing. (Full disclosure: I am investor in CPEFX)
About the Author: Larry Swedroe
—
Important Disclosures
For informational and educational purposes only and should not be construed as specific investment, accounting, legal, or tax advice. Certain information is deemed to be reliable, but its accuracy and completeness cannot be guaranteed. Third party information may become outdated or otherwise superseded without notice. Neither the Securities and Exchange Commission (SEC) nor any other federal or state agency has approved, determined the accuracy, or confirmed the adequacy of this article.
The views and opinions expressed herein are those of the author and do not necessarily reflect the views of Alpha Architect, its affiliates or its employees. Our full disclosures are available here. Definitions of common statistics used in our analysis are available here (towards the bottom).
Join thousands of other readers and subscribe to our blog.