Human judgment isn’t just about logic, it’s also shaped by culture, identity, and unconscious bias. This paper examines how cultural biases affect high-stakes decisions in a FinTech setting, showing that even when information is the same, the social groups we prefer can lead us into worse outcomes. The result: bias isn’t just unethical, it’s expensive.
How costly are cultural biases? Evidence from FinTech
- Francesco D’Acunto, Pulak Ghosh, Rajiv Jain & Alberto G. Rossi
- Journal of Financial Economics, 2026
- A version of this paper can be found here
- Want to read our summaries of academic finance papers? Check out our Academic Research Insight category
Key Academic Insights
In-group preference leads to worse outcomes
Lenders on a large Indian peer-to-peer (P2P) platform showed strong preference for borrowers of their own religious or caste group. Yet when they chose this way, their loans had about 8% higher default rates and roughly 7.3 percentage points lower returns compared to when robo-advisor suggestions were used.
Bias persists even with equal information
In the study, the pool of borrowers, screening processes and incentives were held constant. The only difference was who the lender preferred. Even when a robo-advisor suggested lending to non-preferred groups, lenders often overrode it, suggesting the bias was belief-driven rather than purely preference-driven.
The worst biases emerged where culture is most heated
Lenders located in places with higher historical animus between groups showed stronger biases and worse outcomes. That means cultural context matters, not just individual prejudice.
Practical Applications for Investment Advisors
Scan for cultural bias in decision flow
When evaluating platforms, funds or human agents, ask: Does the decision-architecture default to “familiar group” choices? Do rigs exist to check that? Ensuring diversity of counterparties or algorithmic matching may reduce costly bias.
Use robo or algorithmic recommendations as a check-point
Automated tools can highlight when a decision-maker systematically favors a familiar group. Introducing advisory overrides or blind matching may help remove hidden cost-drivers.
Audit outcomes across sub-groups
Track performance by demographic segments: both of decision-makers and counterparties. If one group consistently underperforms, bias may be lurking in the selection process.
Embed cultural-context risk in your process
If you’re operating in or investing across regions with strong group identity dynamics (religion, caste, ethnicity), it’s prudent to add “cultural bias” as a risk dimension, just like you would liquidity or regulatory risk.
How to Explain This to Clients
“Even when the facts are the same, people tend to pick borrowers or counterparties they’re comfortable with. This comfort can cause them to pick less suitable ones and lose money. In one large FinTech study, lenders who whispered ‘I’ll pick someone like me’ ended up with more defaults and weaker returns. The good news: process fixes can help, which means bias isn’t inevitable.”
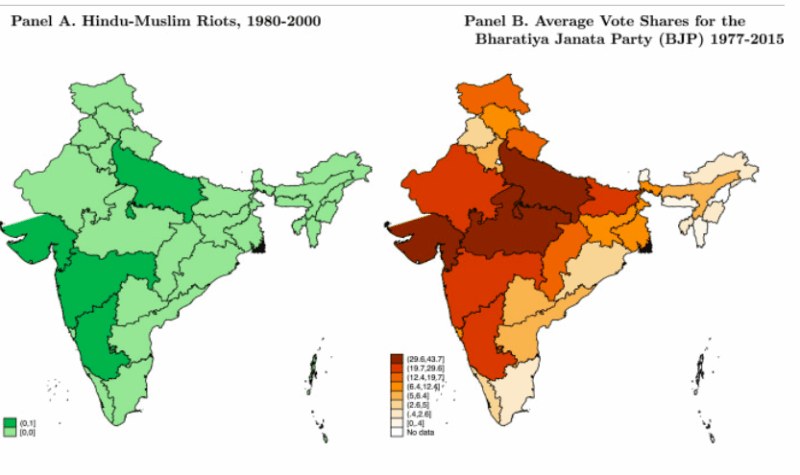
The Most Important Chart from the Paper
Figure 3: Spatial heterogeneity of In-group vs. Out-group conflict. This figure depicts the spatial variation of proxies for the vividness of Hindu-Muslim conflict across Indian states. Panel A compares states in which large-scale riots between Hindus and Muslims and/or pogroms against the Muslim minority happened between 1980 and 2000. Dark green states (Gujarat, Uttar Pradesh, Delhi, Marahashtra, and Karnataka) are states where such events happened based on Ticku (2015). Panel B compares states based on the average vote share of BJP candidates to national and local elections between 1977 and 2015. We obtain candidate-level election results from 1977 to 2015 from Bhavnani (2014). We first compute the voting shares for each election in each state and then average these shares within states. The darker a state, the higher the average BJP vote share. (For interpretation of the references to color in this figure legend, the reader is referred to the web version of this article.)
The results are hypothetical results and are NOT an indicator of future results and do NOT represent returns that any investor actually attained. Indexes are unmanaged and do not reflect management or trading fees, and one cannot invest directly in an index.
Abstract
We study the nature and effects of cultural biases in choice under risk and uncertainty by comparing peer-to-peer loans the same individuals (lenders) make alone and after observing robo-advised suggestions. When unassisted, lenders are more likely to choose co-ethnic borrowers, facing 8% higher defaults and 7.3pp lower returns. Robo-advising does not affect diversification but reduces lending to high-risk co-ethnic borrowers. Lenders in locations with high inter-ethnic animus drive the results, even when borrowers reside elsewhere. Biased beliefs explain these results better than a conscious taste for discrimination: lenders rarely override robo-advised matches to ethnicities they discriminated against when unassisted.
About the Author: Elisabetta Basilico, PhD, CFA
—
Important Disclosures
For informational and educational purposes only and should not be construed as specific investment, accounting, legal, or tax advice. Certain information is deemed to be reliable, but its accuracy and completeness cannot be guaranteed. Third party information may become outdated or otherwise superseded without notice. Neither the Securities and Exchange Commission (SEC) nor any other federal or state agency has approved, determined the accuracy, or confirmed the adequacy of this article.
The views and opinions expressed herein are those of the author and do not necessarily reflect the views of Alpha Architect, its affiliates or its employees. Our full disclosures are available here. Definitions of common statistics used in our analysis are available here (towards the bottom).
Join thousands of other readers and subscribe to our blog.