A longstanding belief in household finance is that wealthier people should buy less insurance because they can afford to self-insure. But this new research turns that idea on its head. This analysis shows that wealthier U.S. households actually purchase more life and property insurance – not less. This surprising result contradicts decades of theory and persists even after accounting for risk tolerance, legal risk, and financial literacy. The implication: many financial planning assumptions about wealth and insurance need to be re-examined.
Wealth and Insurance Choices: Evidence from US Households
- Michael J. Gropper & Camelia M. Kuhnen
- The Journal of Finance , 2025
- A version of this paper can be found here
- Want to read our summaries of academic finance papers? Check out our Academic Research Insight category
Key Academic Insights
Wealthier Households Buy More Insurance—Contrary to Theory
Standard models argue that insurance is a substitute for wealth. The logic is that rich people can cover risks with their savings, so they should buy less insurance. But using administrative data from over 63,000 households and 2.5 million person-months, this paper finds the opposite:
- A $1 increase in financial wealth is associated with a $0.68 increase in term life insurance coverage
- A $1 increase in financial wealth leads to a $2.25 increase in homeowners insurance coverage, even after adjusting for home value
This pattern holds across different types of coverage—life, homeowners, auto—and is robust to within-person regressions. Also note that this study looks at term life insurance only, so the tax-incentives of PPVA/PPLI are not applicable.
Classical Models Can’t Explain the Data
Theory predicts that wealth reduces insurance demand due to diminishing marginal utility and the costliness of insurance products. But when the authors tested this using real-world data, they found:
- Wealthier households don’t get better pricing—they may even pay higher premiums per dollar of coverage
- Wealthier people show higher risk tolerance, allocating more to risky assets (see Figure 4 in the paper)
- Controlling for risk preferences, background risk, and access to employer benefits doesn’t eliminate the wealth-insurance correlation
Bottom line: The data contradict standard models from Mossin (1968), Lewis (1989), and others.
More Wealth = More Risk Coverage… and More Risk?
The authors find that wealthy households face more volatile income and consumption. That might partially explain the higher insurance take-up. But it doesn’t fully close the gap.
- Greater background risk (consumption and income volatility) increases insurance demand
- Litigation risk also plays a role: in states with higher tort exposure, wealthy people buy even more coverage
- Financial literacy and access to credit are correlated with wealth—but don’t account for the entire effect
Practical Applications for Investment Advisors
Rethink Insurance Planning for Affluent Clients
Rather than assuming wealthy clients can self-insure, planners should evaluate:
- How their behavioral preferences or institutional frictions affect their insurance choices
- Their exposure to legal, economic, and idiosyncratic risks
- Whether their current coverage truly reflects those risks
Don’t Overlook Coverage Gaps in Less Wealthy Households
Paradoxically, those who need insurance most are least likely to have it. This is possibly due to:
- Liquidity constraints: high debt-to-income ratios and maxed-out credit cards correlate with lower insurance uptake
- Limited product access or awareness
- Trust and behavioral biases that deter purchase
Financial advisors have an opportunity to help bridge these gaps.
How to Explain This to Clients
“You might think that because you have more savings, you need less insurance. But the data tell a different story. In fact, wealthier households often carry more coverage—not because they have to, but because they choose to hedge more risk. Insurance isn’t just about what you can afford—it’s also about protecting what you’ve built, especially in the face of uncertainty.”
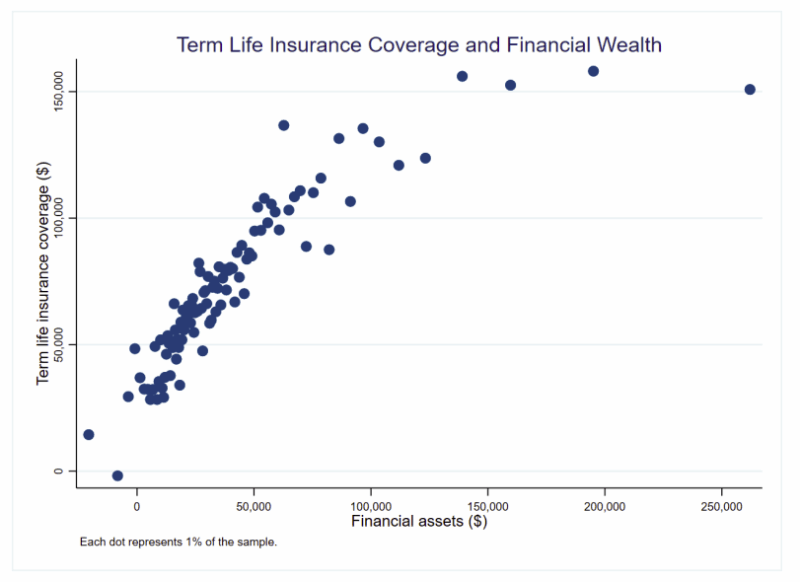
The Most Important Chart from the Paper
This chart shows a strong, positive relationship between financial wealth and life insurance coverage—even after controlling for dependents, mortality risk, housing wealth, and state-level effects. The slope doesn’t flatten until the highest levels of wealth.
The results are hypothetical results and are NOT an indicator of future results and do NOT represent returns that any investor actually attained. Indexes are unmanaged and do not reflect management or trading fees, and one cannot invest directly in an index.
Abstract
We examine the predictability of 299 capital market anomalies enhanced by 30 machine learning
approaches and over 250 models in a dataset with more than 500 million firm-month anomaly
observations. We find significant monthly (out-of-sample) returns of around 1.8-2.0%, and over
80% of the models yield returns equal to or larger than our linearly constructed baseline factor.
For the best performing models, the risk-adjusted returns are significant across alternative asset
pricing models, considering transaction costs with round-trip costs of up to 2% and including
only anomalies after publication. Our results indicate that non-linear models can reveal market
inefficiencies (mispricing) that are hard to conciliate with risk-based explanations.
About the Author: Elisabetta Basilico, PhD, CFA
—
Important Disclosures
For informational and educational purposes only and should not be construed as specific investment, accounting, legal, or tax advice. Certain information is deemed to be reliable, but its accuracy and completeness cannot be guaranteed. Third party information may become outdated or otherwise superseded without notice. Neither the Securities and Exchange Commission (SEC) nor any other federal or state agency has approved, determined the accuracy, or confirmed the adequacy of this article.
The views and opinions expressed herein are those of the author and do not necessarily reflect the views of Alpha Architect, its affiliates or its employees. Our full disclosures are available here. Definitions of common statistics used in our analysis are available here (towards the bottom).
Join thousands of other readers and subscribe to our blog.