Technology is the one thing in our world that never ceases to amaze me.
You want to play an extremely humbling game? Make predictions about technology and check on your performance in a few years.
Let’s play the game…
I predict that technology is going to disrupt the entire financial services economy. Technology will democratize financial knowledge and data, which will allow investors to peek inside the massive conflicts-of-interest box we call “Wall Street.” Once investors are educated and empowered, fees for financial planning will be cut in half. The days of “two and twenty” will be limited to uber niche and highly specialized asset managers. Fees for financial data services will be cut in half (watch out Capital IQ, Factset, and Bloomberg)…Okay, that is a healthy list of wild predictions that will surely bury me in rotten eggs and tomatoes in 5-years.
On the prediction that “Fees for financial data services will be cut in half (watch out Capital IQ, Factset, and Bloomberg)” I present a new tool produced by Greg Ugwi. Greg is a Princeton graduate and worked at the Vampire Squid (Also known as Goldman Sachs). He’s developed an unbelievable tool for fundamental investors called ThinkNum.com.
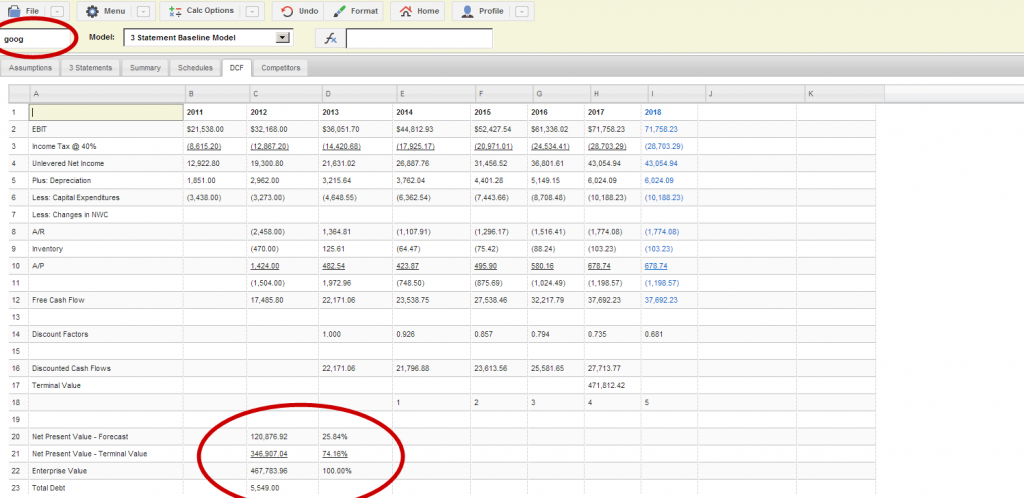
Here is a quick screenshot of a DCF model I generated on Google:
I’ll recap some of the highlights:
Fundamental Valuation
Thinknum is developing a tool that enables fundamental analysis on the web.
When you enter a ticker into the cashflow model app, it displays multiple projections of the associated company’s intrinsic value. What is interesting about Thinknum is you can pull up the model that was used to project each intrinsic value. All the assumptions that went into the valuation are visible and editable so if you like a model, but disagree with a certain assumption, you can replace that assumption and the new intrinsic value gets computed instantly. The data for the models is updated automatically when companies publish their quarterly filings.
Open Data
When attempting to develop this tool, Thinknum discovered there was no platform to get quality fundamental financial data without paying thousands in fees per user per month and set out to solve this problem. (Watch out CapitalIQ).
They designed an object database that utilizes a graph model. The primary nodes in the graph are corporations and the aim is to keep track of all the data and relationships that would be useful for valuing companies. Thinknum’s website is designed to let users interact with the graph in intelligent ways. For example, to view the revenue for Google, a user can type total_revenue(goog) ( Click on any of the columns to pull up the exact filing where this data point was pulled from ). Users can manipulate the time-series data using mathematical expressions so you can type yield@10yr – yield@2yr to plot the two year ten year spread. The interactive front end allows traders and investors to analyze financial data without having to writing code.
Thinknum’s Business Plan.
Users do not have to pay to use Thinknum and developers can access the data though an API. All the models that are saved are open source by default. Thinknum is planning to allow institutional clients, who pay a monthly fee, create models that are not visible to the public.
I think this is pretty cool and wish Greg the best of luck.
Note: This Recommendation is 100% conflict-free. We receive no payments, kickbacks, gold nuggets, or bitcoin from Greg. We don’t receive anything! I simply like the idea Greg is pulling together and I love supporting entrepreneurs with cool ideas.
About the Author: Wesley Gray, PhD
—
Important Disclosures
For informational and educational purposes only and should not be construed as specific investment, accounting, legal, or tax advice. Certain information is deemed to be reliable, but its accuracy and completeness cannot be guaranteed. Third party information may become outdated or otherwise superseded without notice. Neither the Securities and Exchange Commission (SEC) nor any other federal or state agency has approved, determined the accuracy, or confirmed the adequacy of this article.
The views and opinions expressed herein are those of the author and do not necessarily reflect the views of Alpha Architect, its affiliates or its employees. Our full disclosures are available here. Definitions of common statistics used in our analysis are available here (towards the bottom).
Join thousands of other readers and subscribe to our blog.


