Pop quiz:
A stock you own just hit a 52-week high…
Does it make you nervous?
On Wall Street, there are many highly publicized metrics that can trigger an emotional response in investors. The “52-week high” signal is a great example. It is a widely reported (e.g., Barron’s, WSJ, MarketWatch) and easily noticed statistic. Stocks at 52-week highs are at their peak versus historical values, and this is, presumably, valuable information. Also, peaks per se are salient, almost by definition, and so we tend to pay a lot of attention to them.
Psychological studies have shown that people exhibit an availability bias, placing undue emphasis on facts and examples that are salient, prominent or easily recalled. A recent earthquake, for example, will cause us to adjust our base rates, and temporarily overestimate the likelihood of earthquakes.
So how do people perceive stocks that are at a 52-week high, and might this metric cause us to do something inappropriate?
Anchoring and Framing
The anchoring effect describes how we can be influenced, or “anchored,” on specific information.
In “Psychological Barriers, Expectational Errors, and Underreaction to News,” (a copy is here) Justin Birru argues that when stocks are at a 52-week high, this creates a psychological barrier of sorts, beyond which investors think the stock is unlikely to go. Investors discount the possibility that the stock will continue higher, which induces them to sell.
Our associative machinery, with its tendency to create narratives to accompany our observations, might say something like,
“This stock has run up a lot and so it is expensive relative to where it’s traded in the past year. I better sell now, since the price is undoubtedly good, at least relative to where it has been.”
It may be that there is also an implicit frame created by the 52-week lookback period, and frames affect how we perceive reality. An observation at the extreme edge of such an evaluative frame is rare. After all, there are lots of observations inside the frame, but none outside. It seems reasonable to think that future observations might resemble past observations and therefore fall within the frame (even if this is not necessarily true). This may cause us to underweight the probability that the stock will move outside the frame, and we become pessimistic about future increases.
Note that we may evaluate the 52-week signal independently of other statistical signals, such as valuation. The stock may still be cheap on a PE basis, but even so, the 52-week frame has suddenly become very available and thus important to us, and we underweight the importance of PE relative to it.
One way to evaluate investor pessimism for stocks at 52-week highs is to examine what happens to these stocks around earnings announcements.
Do investors make expectational errors with respect to these stocks?
The Evidence Hath Spoken
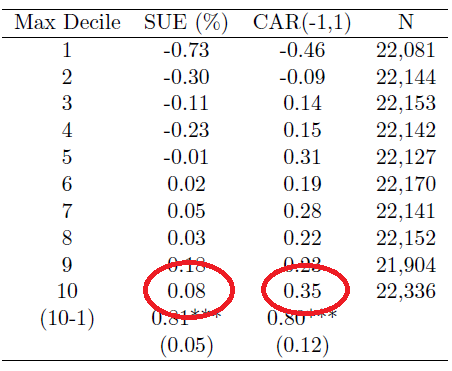
Birru found strong evidence that investors became overly pessimistic about earnings for stocks near a 52-week high, since they were systematically surprised by subsequent strong earnings. Note, in the chart below, how stocks in the 10th decile (near their 52-week highs), exhibited 1) positive earnings surprises (SUE), and 2) positive abnormal returns around the announcement:

The results are hypothetical results and are NOT an indicator of future results and do NOT represent returns that any investor actually attained. Indexes are unmanaged, do not reflect management or trading fees, and one cannot invest directly in an index. Additional information regarding the construction of these results is available upon request.
- SUE represents Standard Unexpected Earnings, which is the difference between realized earnings and analyst forecasts.
- CAR (-1, 1) represents Cumulative Abnormal Returns (Fama-French size-B/M adjusted) in the 3 days around the announcement.
Clearly, these strong earnings results were not anticipated by the market, and Birru hypothesizes that this occurs because investors improperly anchor on the 52-week high.
So if one of your stocks hits a new 52-week high, you probably shouldn’t be nervous. In fact, perhaps you should be excited.
While it would seem the evidence is pretty solid, there are still at least some market observers who would counsel you otherwise.
An example: Investing Answers — ironically — has the wrong investment answer. Their article states the following:
The 52-week high serves as an indicator for potential investors. Investor’s will often reference the 52-week high for a stock when looking at the current price. If the price is near or approaching the 52-week high, it might not be a good time to buy, because the stock could be overvalued. Also, if a stock is near its 52 week high, this may be a signal that it is a good time to sell.
Remarkable (emphasis on irony).
Another situation where evidence trumps a good story…
Are you a story-based investor, or an empirical-based investor?
About the Author: David Foulke
—
Important Disclosures
For informational and educational purposes only and should not be construed as specific investment, accounting, legal, or tax advice. Certain information is deemed to be reliable, but its accuracy and completeness cannot be guaranteed. Third party information may become outdated or otherwise superseded without notice. Neither the Securities and Exchange Commission (SEC) nor any other federal or state agency has approved, determined the accuracy, or confirmed the adequacy of this article.
The views and opinions expressed herein are those of the author and do not necessarily reflect the views of Alpha Architect, its affiliates or its employees. Our full disclosures are available here. Definitions of common statistics used in our analysis are available here (towards the bottom).
Join thousands of other readers and subscribe to our blog.

