Stock Duration and Misvaluation
- Martijn Cremers, Ankur Pareek, and Zacharias Sautner
- A version of the paper can be found here.
Abstract:
We study whether the presence of short-term investors is related to a speculative component in stock prices using a new measure of holding duration. First, we characterize institutional investors’ holding durations since 1985 and find that holding durations have been stable and, if anything, slightly lengthened over time. Second, we document that the presence of short-term investors is strongly related to temporary price distortions, consistent with a speculative stock component in stock prices as modeled in Bolton, Scheinkman, and Xiong (2006). As short-term investors move into (out of) stocks, their prices tend to go up (down) relative to fundamentals. As the presence of short-term investors is strongly mean-reverting, this creates a predictable pattern in stock returns. We document such predictability using both valuation proxies and asset pricing tests.
Data Sources:
NYSE, AMEX, and NASDAQ and the Thomson 13-F database. 1985-2010.
Alpha Highlight:
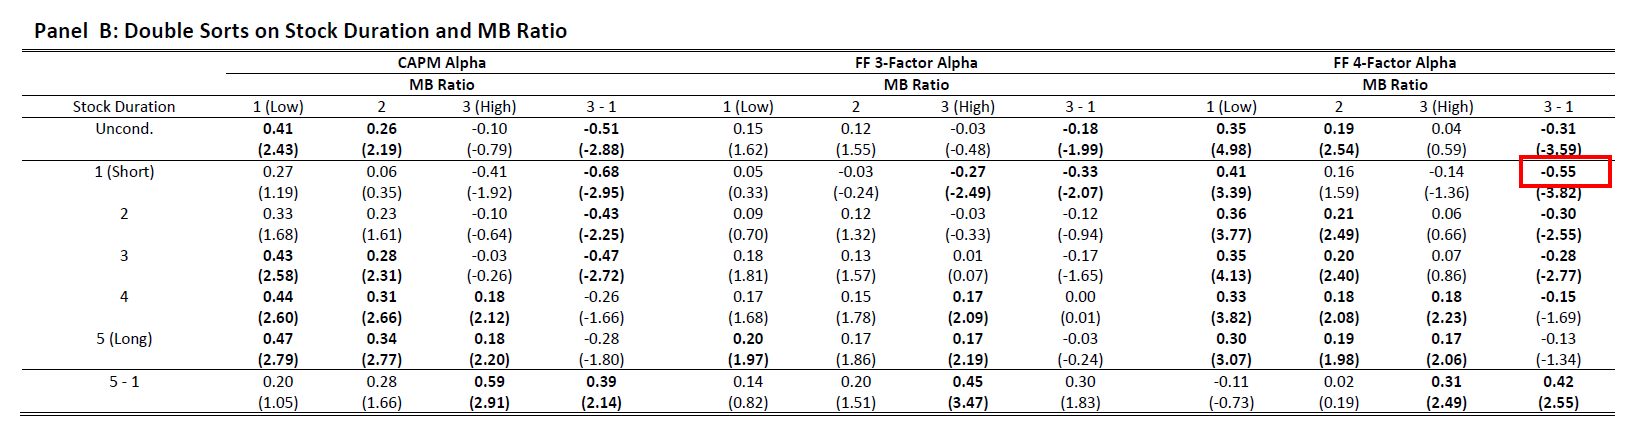
[Click to enlarge] The results are hypothetical results and are NOT an indicator of future results and do NOT represent returns that any investor actually attained. Indexes are unmanaged, do not reflect management or trading fees, and one cannot invest directly in an index. Additional information regarding the construction of these results is available upon request.
Investment Strategy:
- Calculate the stock duration measure for institutional investors quarterly as in the paper.
- Calculate each firm’s MTB as well as past 6-month stock returns.
- Sort duration into quintiles, MTB into terciles, and past 6-month returns into 2 groups.
- At the end of each quarter, go long stocks in the lowest MTB tercile and lowest duration quintile, and go short stocks in the highest MTB tercile and lowest duration quintile. Hold this portfolio for a year.
- The portfolios will overlap, each quarter you will add more stocks based on the sorts, and hold the new stocks for a year. All portfolios are EW and yield 0.55% alpha per month (Table 6).
- To improve the performance of the strategy, first split stocks into high and low past 6-month returns.
- Using only the stocks in the low past 6-month returns group, form portfolios as above, going long stocks in the lowest MTB tercile and lowest duration quintile, and going short stocks in the highest MTB tercile and lowest duration quintile.
- Hold this portfolio for a year and each quarter add more stocks. All portfolios are EW and yield 0.63% alpha per month (Table 7).
Commentary:
- Paper shows some of the value – growth premium can be explained by stocks with shorter duration.
- Duration measure is a little complicated.

About the Author: Wesley Gray, PhD
—
Important Disclosures
For informational and educational purposes only and should not be construed as specific investment, accounting, legal, or tax advice. Certain information is deemed to be reliable, but its accuracy and completeness cannot be guaranteed. Third party information may become outdated or otherwise superseded without notice. Neither the Securities and Exchange Commission (SEC) nor any other federal or state agency has approved, determined the accuracy, or confirmed the adequacy of this article.
The views and opinions expressed herein are those of the author and do not necessarily reflect the views of Alpha Architect, its affiliates or its employees. Our full disclosures are available here. Definitions of common statistics used in our analysis are available here (towards the bottom).
Join thousands of other readers and subscribe to our blog.