Value Investing: The Use of Historical Financial Statement Information to Separate Winners from Losers
- Joseph Piotroski
- A version of the paper can be found here.
Abstract:
This paper examines whether a simple accounting-based fundamental analysis strategy, when applied to a broad portfolio of high book-to-market firms, can shift the distribution of returns earned by an investor. I show that the mean return earned by a high book-to-market investor can be increased by at least 7 percent annually through the selection of financially strong high BM firms while the entire distribution of realized returns is shifted to the right. In addition, an investment strategy that buys expected winners and shorts expected losers generates a 23 percent annual return between 1976 and 1996 and the strategy appears to be robust across time and to controls for alternative investment strategies. Within the portfolio of high BM firms, the benefits to financial statement analysis are concentrated in small and medium sized firms, companies with low share turnover and firms with no analyst following, yet this superior performance is not dependent on purchasing firms with low share prices. A positive relationship between the sign of the initial historical information and both future firm performance and subsequent quarterly earnings announcement reactions suggests that the market initially underreacts to the historical information. In particular, 1/6th of the annual return difference between ex ante strong and weak firms is earned over the four three-day periods surrounding these quarterly earnings announcements. Overall, the evidence suggests that the market does not fully incorporate historical financial information into prices in a timely manner.
Data Sources:
The historical accounting data is from the COMPUSTAT database. Return data is from the CRSP database. All firms with an annual book value of equity figure are included in the sample.
Discussion:
In the academic literature, the highest book-to-market portfolio (value portfolio) has created controversy. On one hand, efficient market theorists believe the “value portfolio” outperforms the market because the portfolio is fundamentally riskier than the broader market. A pile of academic evidence suggests that this “market efficiency” hypothesis is correct.
On the other hand, practitioners–and even some academics (Lakonishok, Shleifer and Vishny, for example)–suggest that the value portfolio outperforms because of behavioral biases, such as glamour infatuation or over-extrapolating growth prospects, or agency problems. Inefficient-market-believers point to robust evidence that value stocks outperform because the market is inefficient.
To summarize, the current literature supports the market efficiency and the market inefficiency hypothesis…
What???
Financial research, like any other social science, involves a bit of ‘art’ and a bit of ‘science.’ Unfortunately, the ‘art’ component of financial research typically translates into “enough wiggle room, such that I can set up my tests to support my viewpoint.” As financial economists, we have a bit of “physics envy,” and we all really wish we were real scientists, but hey, sometimes you can’t get what you want…
Regardless of what the critics say, this paper makes a fairly compelling point that an investor can use fundamentals to separate out the ‘good’ value companies from the ‘bad.’ Of course, I’m biased and believe the market is not efficient (at the margin, at least).
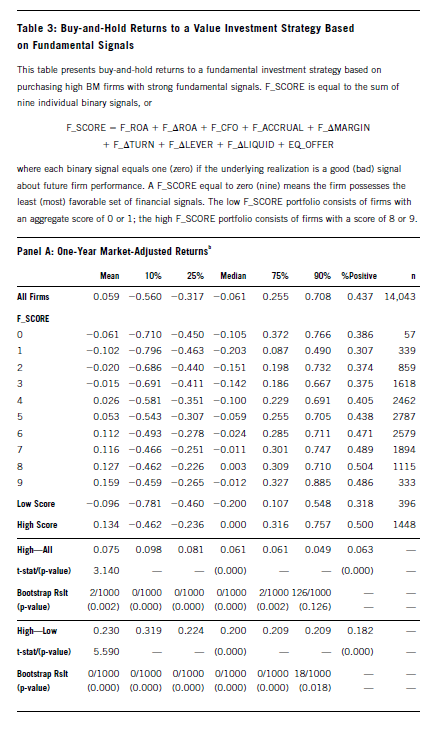
The author of this paper tests whether his FSCORE measure can help investors determine which “value” firms to buy and sell. The idea is that FSCORE should screen out the “bad” value firms and keep the “good” ones. Joe identifies nine variables to help him do this.
The FSCORE is calculated by counting “points.” Each stock gets one point for each of the following that is positive:
- ROA: Net Income excluding extraordinary items(t) / Total Assets (t-1)
- Change ROA: Year over Year change in ROA variable.
- CFO: Cash from Operations (t) /Total Assets (t-1)
- Accrual: CFO-ROA
- Change Lever: LT Debt/Total Assets(t) -LT Debt (t-1)/Total Assets (t-2)
- Change Liquid: Current Ratio (t)-Current Ratio (t-1)
- Equity Issuance: Issue Equity=0, No Equity Issue=1
- Change Margin: Gross Margin (t)-Gross Margin (t-1)
- Change Turnover: Asset Turnover (t)-Asset Turnover (t-1)
The key results are highlighted in Table 3:

The results are hypothetical results and are NOT an indicator of future results and do NOT represent returns that any investor actually attained. Indexes are unmanaged, do not reflect management or trading fees, and one cannot invest directly in an index. Additional information regarding the construction of these results is available upon request.
Before costs, a L/S system earns almost 23% a year–that rivals the return of the greatest value investors of all time. Interesting.
Investment Strategy:
Step 1: Using prior fiscal year book to market, separate the investment universe into book to market quintiles for the upcoming year. Then choose the highest book-to-market quintile (top 20%). These names make up your “value” universe.
Step 2: Within the value stocks, calculate FSCORE measures for every stock, so that each stock has an FSCORE between 0 and 9 (0=bad, 9=good), and put the respective companies into their respective FSCORE portfolios. This step is separating “good” from “bad.”
Step 3: Go long an equal weight portfolio of the highest FSCORE companies (scores of 8 and 9) and short an equal weight portfolio of the lowest FSCORE companies (scores of 0 and 1).
Step 4: Outperform the market.
Step 5 (optional): Hedge out size risk. See the table below.
Commentary:
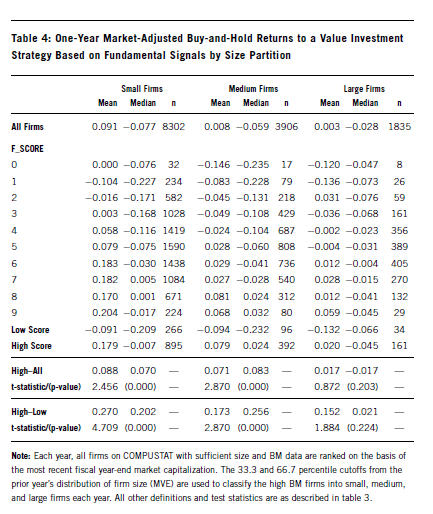
The paper goes into great detail and outlines many tests to see if the results are dependent on size factors, liquidity factors, analyst following factors, and so forth. The bottom line is that fundamental analysis seems to work no matter how you cut it. Nevertheless, as the paper shows, how well the FSCORE works really depends on how one uses it. Not surprisingly, the best place to implement the FSCORE is in underfollowed, low liquidity, small cap stocks.
Check out table 4 below.
Something immediately jumps out at the astute trader–size matters. Women have been saying this for years, but now Piotroski is reiterating the point. Although returns are still positive and marginally significant for “large firms,” there is no doubt that all the “alpha” in this strategy is focused in the smaller names.
My guess is you can cut 50% of the returns right off the top after adjusting for costs, short sale constraints, etc. So an investor is looking at a L/S that cranks out 13.5% a year in expected alpha–not bad.

The results are hypothetical results and are NOT an indicator of future results and do NOT represent returns that any investor actually attained. Indexes are unmanaged, do not reflect management or trading fees, and one cannot invest directly in an index. Additional information regarding the construction of these results is available upon request.
Also, if you are interested in reading a whole flurry of really cool “value anomaly” papers, head to the Ben Graham Center for Value Investing:
http://www.bengrahaminvesting.ca/Research/Academic_Research/published_papers.htm
Piotroski merely hits the wave-tops when it comes to quantitative value investing, but if you want to get more details there are multiple research papers available for the curious reader.
About the Author: Wesley Gray, PhD
—
Important Disclosures
For informational and educational purposes only and should not be construed as specific investment, accounting, legal, or tax advice. Certain information is deemed to be reliable, but its accuracy and completeness cannot be guaranteed. Third party information may become outdated or otherwise superseded without notice. Neither the Securities and Exchange Commission (SEC) nor any other federal or state agency has approved, determined the accuracy, or confirmed the adequacy of this article.
The views and opinions expressed herein are those of the author and do not necessarily reflect the views of Alpha Architect, its affiliates or its employees. Our full disclosures are available here. Definitions of common statistics used in our analysis are available here (towards the bottom).
Join thousands of other readers and subscribe to our blog.

