The results are hypothetical results and are NOT an indicator of future results and do NOT represent returns that any investor actually attained. Indexes are unmanaged, do not reflect management or trading fees, and one cannot invest directly in an index. Additional information regarding the construction of these results is available upon request.
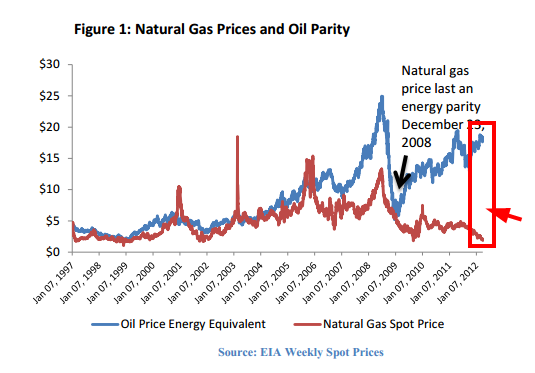
The chart above (with my annotations on the far right) is from a research piece by The Carlyle Group.
From 1997 to 2005 oil and natural gas sat roughly at parity on an energy-adjusted basis. The spread widened thereafter, but came back in line when oil crashed.
Now we face the most epic spread in history.
Question: Is this one of the greatest opportunities in history? Or is this going to go down as the biggest “pain trade” of all time?
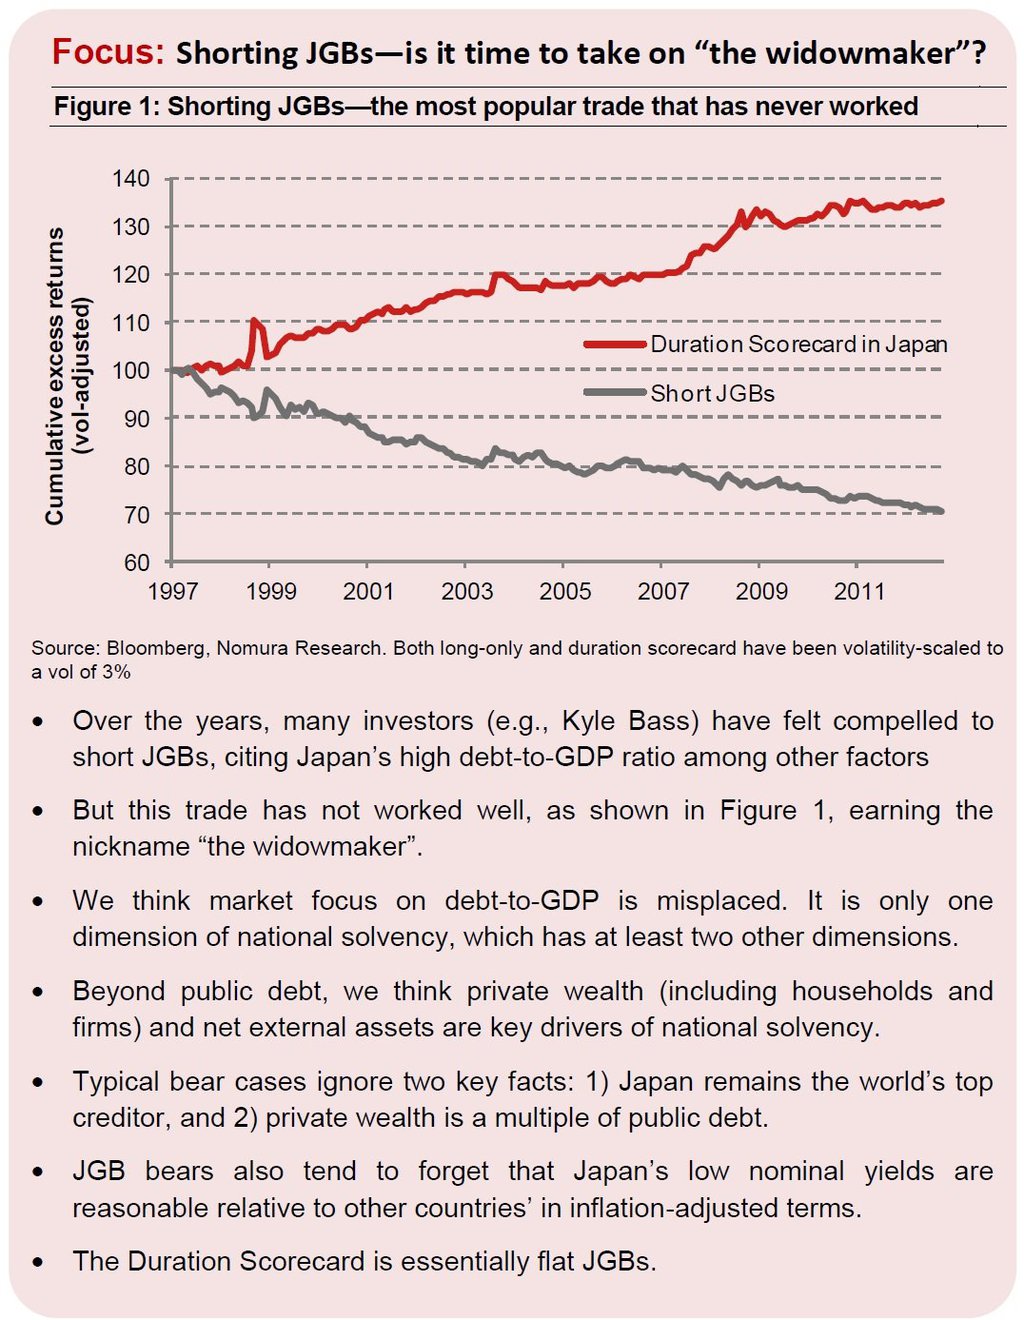
http://www.businessinsider.com/nomura-on-shorting-japanese-government-bonds-2012-10

About the Author: Wesley Gray, PhD
—
Important Disclosures
For informational and educational purposes only and should not be construed as specific investment, accounting, legal, or tax advice. Certain information is deemed to be reliable, but its accuracy and completeness cannot be guaranteed. Third party information may become outdated or otherwise superseded without notice. Neither the Securities and Exchange Commission (SEC) nor any other federal or state agency has approved, determined the accuracy, or confirmed the adequacy of this article.
The views and opinions expressed herein are those of the author and do not necessarily reflect the views of Alpha Architect, its affiliates or its employees. Our full disclosures are available here. Definitions of common statistics used in our analysis are available here (towards the bottom).
Join thousands of other readers and subscribe to our blog.