The graphic below highlights the performance of the biggest names in the hedge fund business. Their historical survivor-bias-filled track record is amazing.
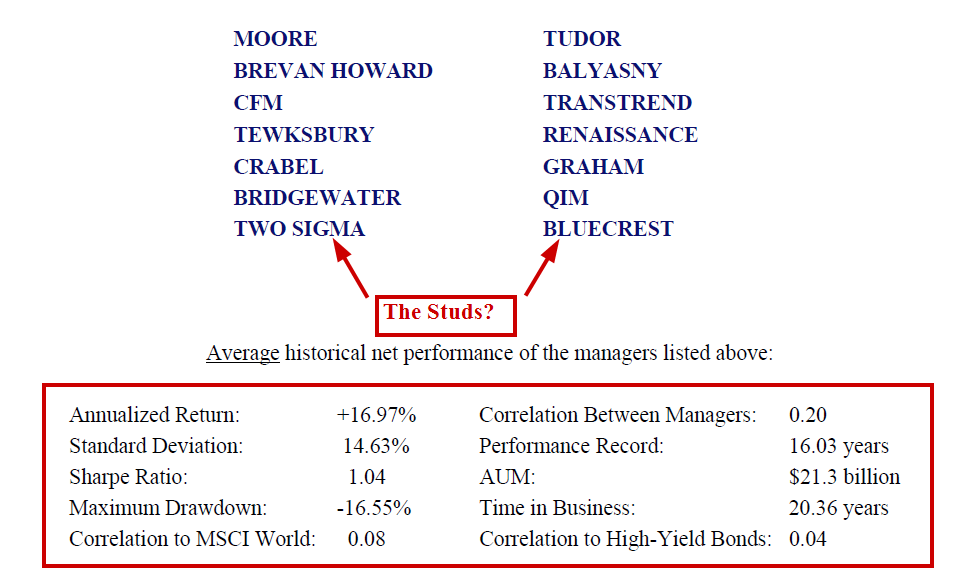
Source: Alpha Titans
Just how amazing is the performance?
Not really that amazing.
Below I highlight the performance of a portfolio that takes $1 and invests it in 10-year bonds. The portfolio then borrows $1.50 and allocates 25cents to the S&P 500 and $1.25 in the 10-year. I assume the cost of borrow is the t-bill rate+30bps (funding spread). Effectively, you have a 2.25x 10-year position and 25% S&P 500 allocation, or a gross 2.50x lever. The performance over the past ~16.03 years (4/1/1997 to 7/31/2013) is presented below (trying to mirror the period for the stats above):
Passive HF
- 15%+ CAGR
- 16.84% MaxDD
- ~0 correlation with common equity benchmarks
- Fully transparent; no lockups; no fraud risk; no K1s; no due diligence; no skill

The results are hypothetical results and are NOT an indicator of future results and do NOT represent returns that any investor actually attained. Indexes are unmanaged, do not reflect management or trading fees, and one cannot invest directly in an index. Additional information regarding the construction of these results is available upon request.
Who’s ready to allocate $10B? …I’ll charge 25bps…Bueller?
And here are the annuals:

The results are hypothetical results and are NOT an indicator of future results and do NOT represent returns that any investor actually attained. Indexes are unmanaged, do not reflect management or trading fees, and one cannot invest directly in an index. Additional information regarding the construction of these results is available upon request.
Incredible, isn’t it? Of course, one would be insane to think that the performance of this levered 10-year with S&P 500 portfolio will perform similarly in the future.
But would one be insane to think that the performance of the “genius” hedge funds of the past 16 years has been driven by direct or indirect exposures (short book interest) to leverage and long-term bonds?
The results above highlight that a barney-style strategy that simply levers on long bonds and allocates a bit to domestic equity risk can generate a healthy return. Pile in a few more asset classes and add some additional leverage and–MAGIC–you have a performance record after fees that is essentially the same as the “best in the industry.”
Data-mining you say? Of course. But looking back over the past 16 years and clustering the top performing managers–after the fact–is data-mining as well.
Remarkably, these same “genius” hedge fund managers have overwhelmingly had lackluster performance over the past few years–just like the long-term bond.
I’m not saying, but I’m just saying…
Where are the returns of the future going be?

About the Author: Wesley Gray, PhD
—
Important Disclosures
For informational and educational purposes only and should not be construed as specific investment, accounting, legal, or tax advice. Certain information is deemed to be reliable, but its accuracy and completeness cannot be guaranteed. Third party information may become outdated or otherwise superseded without notice. Neither the Securities and Exchange Commission (SEC) nor any other federal or state agency has approved, determined the accuracy, or confirmed the adequacy of this article.
The views and opinions expressed herein are those of the author and do not necessarily reflect the views of Alpha Architect, its affiliates or its employees. Our full disclosures are available here. Definitions of common statistics used in our analysis are available here (towards the bottom).
Join thousands of other readers and subscribe to our blog.