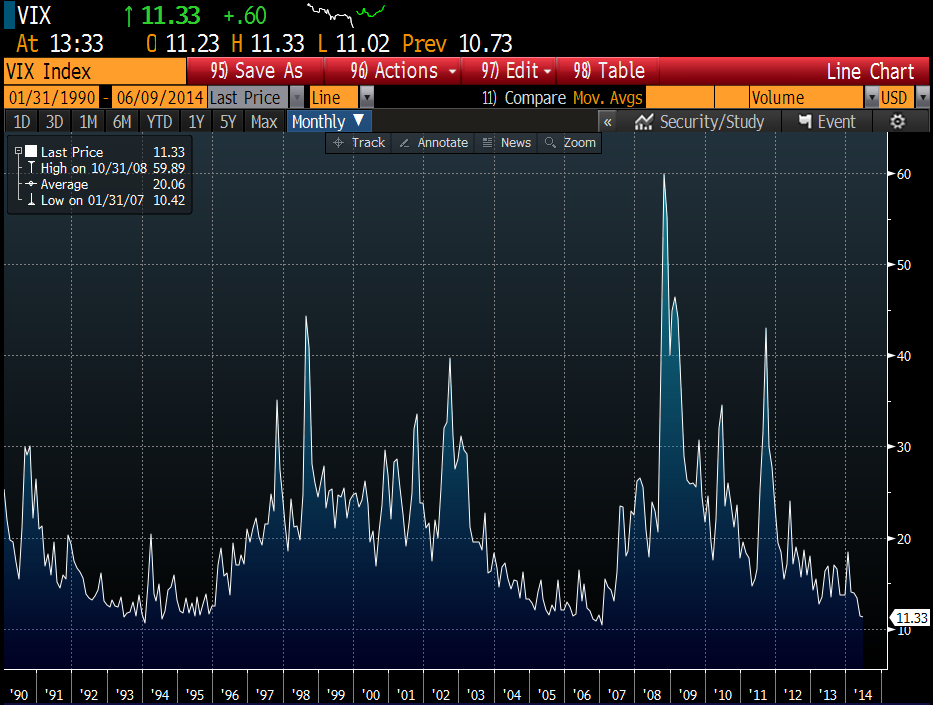
VIX is currently sitting at the lowest levels since all the way back to 2007, and market valuations are rich.
The chart below highlights VIX over the past 24 years.

The results are hypothetical results and are NOT an indicator of future results and do NOT represent returns that any investor actually attained. Indexes are unmanaged, do not reflect management or trading fees, and one cannot invest directly in an index. Additional information regarding the construction of these results is available upon request.
We were all sitting around the office the other day thinking about how expensive markets are around the world. And because we all are value investors by nature, the thought of high valuations scares us. That said, we know the perils of following your “instinct” so we always defer to models, but given these high prices and the iron law of finance, whereby what goes up must come down, the thought experiment of pricing out market insurance was too exciting to pass up.
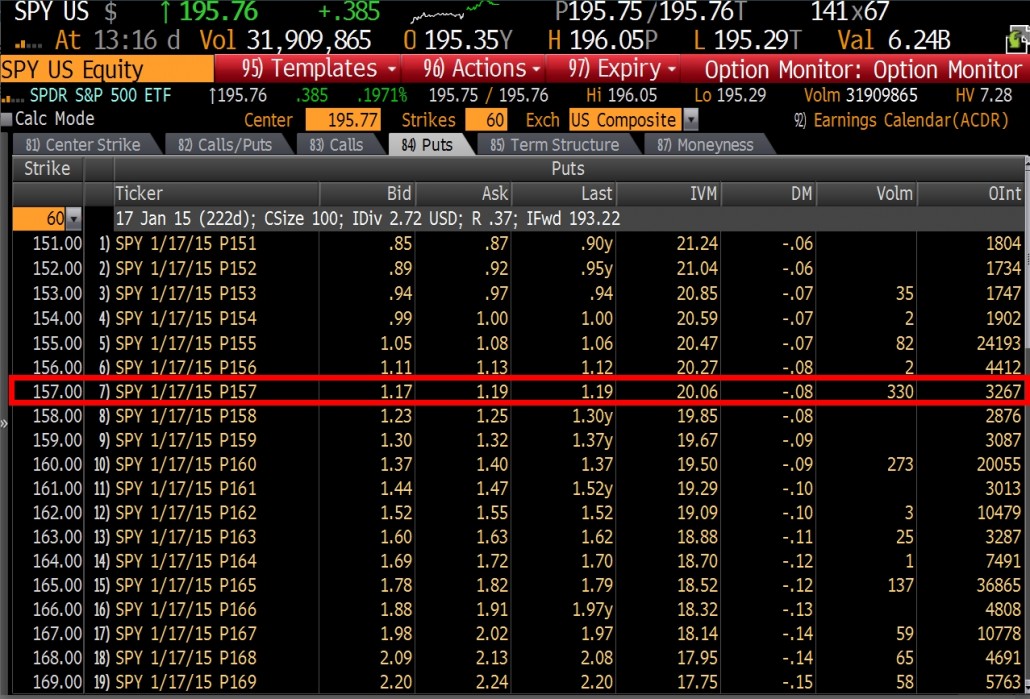
I had Tao fire up the Bloomberg and get the put prices for the Jan 17 2015 contracts.
How much does it cost to ensure a 20% maximum drawdown? 60bps! You can pay 1.18 (avg b/a) and buy puts at 157, which is roughly a 20% drop from the current price of ~196 on SPY. 1.18/196 works out to around 60bps.

The results are hypothetical results and are NOT an indicator of future results and do NOT represent returns that any investor actually attained. Indexes are unmanaged, do not reflect management or trading fees, and one cannot invest directly in an index. Additional information regarding the construction of these results is available upon request.
But just how likely is a 20%+ maximum drawdown?
Seems pretty cheap, right? But that depends on how likely such a 20% drawdown is. Certainly, we could look to history for clues about this.
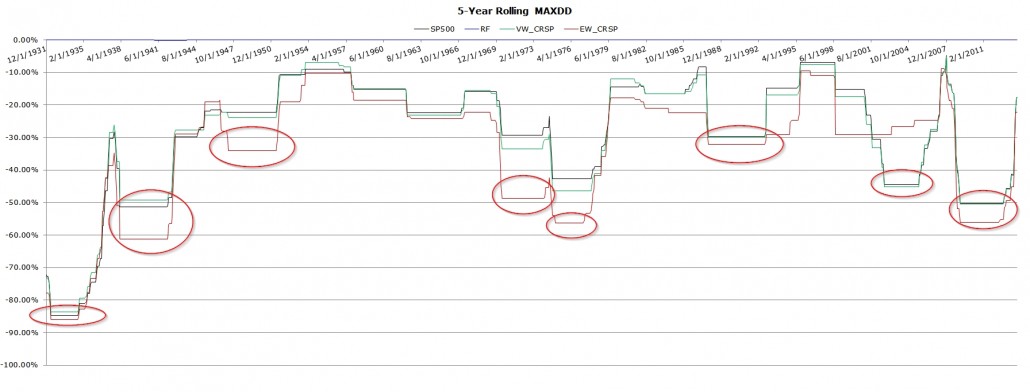
First, a look at rolling 5-year maximum drawdowns (a five-year rolling window). Hitting a nasty drawdown every 5-10 years is almost inevitable.

The results are hypothetical results and are NOT an indicator of future results and do NOT represent returns that any investor actually attained. Indexes are unmanaged, do not reflect management or trading fees, and one cannot invest directly in an index. Additional information regarding the construction of these results is available upon request.
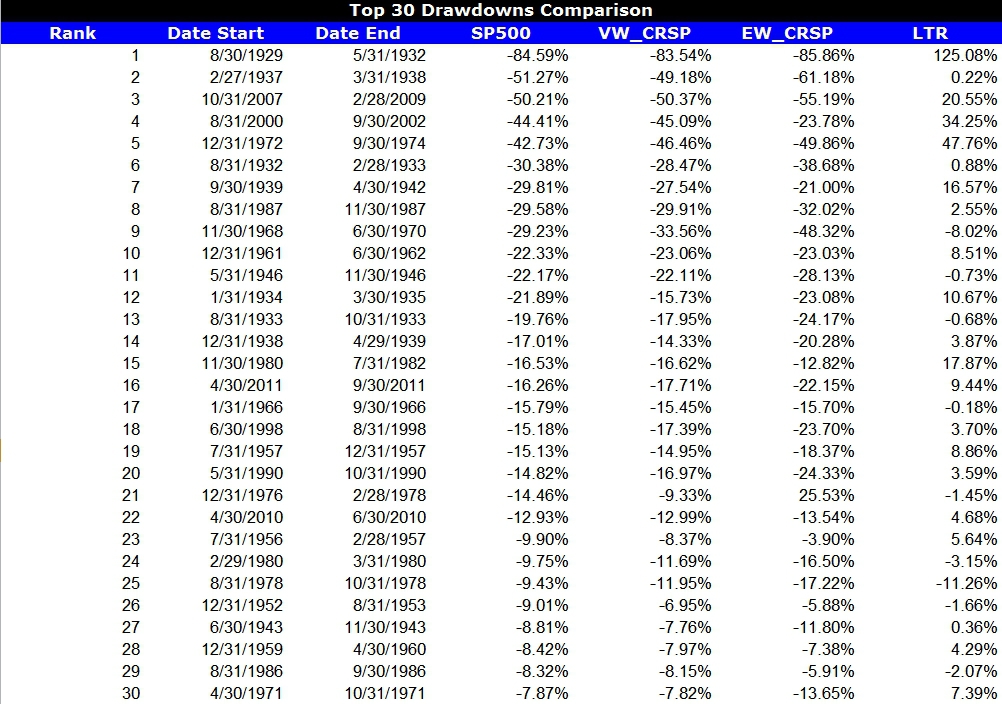
Below we analyze the top 30 drawdowns from 1927 through 2013 for the S&P 500 total return index.

The results are hypothetical results and are NOT an indicator of future results and do NOT represent returns that any investor actually attained. Indexes are unmanaged, do not reflect management or trading fees, and one cannot invest directly in an index. Additional information regarding the construction of these results is available upon request.
So large drawdowns are certainly probable, but not hyper frequent. Of course, these results are unconditional and don’t take into account current valuations. Nonetheless, they serve as a nice benchmark which we can use to think through the potential value of buying insurance in the current market environment.
Notice the 10-year return (marked LTR)? Wow.
Conclusion
I’m relatively young with a long runway to compound out of a nasty max drawdown event, so I’m going to probably pass on insurance. However, if you are retired, worried about current market valuations, and can’t stand the thought of losing more than 20% of your nest egg, you might want to think about buying insurance on the market while it is relatively cheap. As always, you should explore the idea with your own financial advisor and make sure the idea makes sense for your portfolio.
About the Author: Wesley Gray, PhD
—
Important Disclosures
For informational and educational purposes only and should not be construed as specific investment, accounting, legal, or tax advice. Certain information is deemed to be reliable, but its accuracy and completeness cannot be guaranteed. Third party information may become outdated or otherwise superseded without notice. Neither the Securities and Exchange Commission (SEC) nor any other federal or state agency has approved, determined the accuracy, or confirmed the adequacy of this article.
The views and opinions expressed herein are those of the author and do not necessarily reflect the views of Alpha Architect, its affiliates or its employees. Our full disclosures are available here. Definitions of common statistics used in our analysis are available here (towards the bottom).
Join thousands of other readers and subscribe to our blog.

