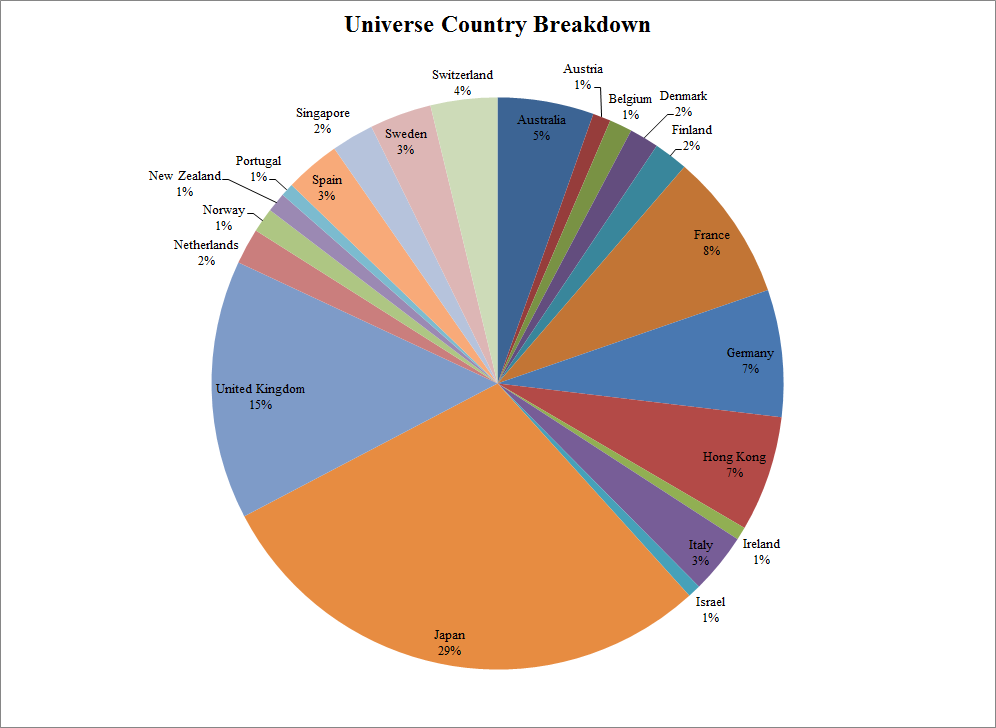
We ran some numbers on the large liquid universe of stocks (>2B USD) traded in EAFE countries. In total there are 1086 names in the universe.
We like to focus analysis on large and liquid securities because this eliminates potential outliers and prevents the results from being driven by micro-caps. Having spun the data so many times, it is remarkable that people believe ANY results that include small-cap securities. The data is poor, erratic, and allows the author of the study to manipulate the results behind the scenes. Yuck!
A quote from Eugene Fama on the subject:
Microcaps can be influential in EW hedge portfolio returns for two reasons. First, though microcaps are on average only about 3% of the market cap of the NYSE-Amex-NASDAQ universe, they account for about 60% of the total number of stocks. Second, the cross-section dispersion of anomaly variables is largest among microcaps, so they typically account for more than 60% of the stocks in extreme sort portfolios.
From a practical perspective, if the extreme returns associated with an anomaly variable are special to microcaps, they are probably not realizable because of the high costs of trading such stocks.
We have also chosen the EBIT/TEV measure as the valuation metric, because our own research supports the argument that it is most predictive for future stock returns.
- Journal of Portfolio Management Article
- Quantitative Value Chapters 7/8
- Loughran and Wellman paper highlighting the outperformance of Enterprise multiples
The results are hypothetical results and are NOT an indicator of future results and do NOT represent returns that any investor actually attained. Indexes are unmanaged, do not reflect management or trading fees, and one cannot invest directly in an index. Additional information regarding the construction of these results is available upon request.
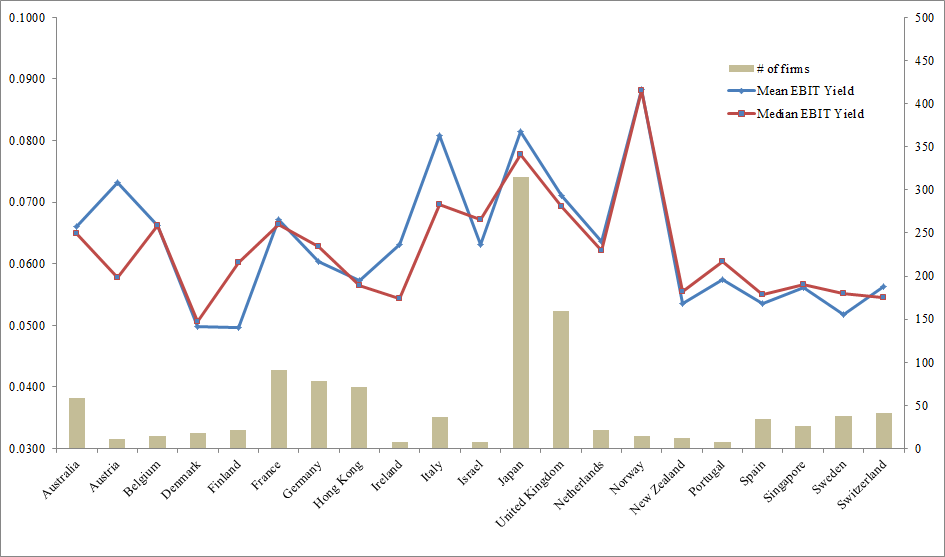
Here we plot the median and mean EBIT/TEV (EBIT Yield) measure for each country and the number of stocks in each country (that are included in our large liquid universe).
The results are hypothetical results and are NOT an indicator of future results and do NOT represent returns that any investor actually attained. Indexes are unmanaged, do not reflect management or trading fees, and one cannot invest directly in an index. Additional information regarding the construction of these results is available upon request.
Japan is relatively cheap within the universe. Norway and Italy are also cheap.

About the Author: Wesley Gray, PhD
—
Important Disclosures
For informational and educational purposes only and should not be construed as specific investment, accounting, legal, or tax advice. Certain information is deemed to be reliable, but its accuracy and completeness cannot be guaranteed. Third party information may become outdated or otherwise superseded without notice. Neither the Securities and Exchange Commission (SEC) nor any other federal or state agency has approved, determined the accuracy, or confirmed the adequacy of this article.
The views and opinions expressed herein are those of the author and do not necessarily reflect the views of Alpha Architect, its affiliates or its employees. Our full disclosures are available here. Definitions of common statistics used in our analysis are available here (towards the bottom).
Join thousands of other readers and subscribe to our blog.