Simple Technical Trading Rules and the Stochastic Properties of Stock Returns
- Brock, Lakonishok, and LeBaron
- A version of the paper can be found here.
- Want a summary of academic papers with alpha? Check out our Academic Research Recap Category!
Abstract:
This paper tests two of the simplest and most popular trading rules–moving average and trading range break-by utilizing the Dow Jones Index from 1897 to 1986. Standard statistical analysis is extended through the use of bootstrap techniques. Overall, our results provide strong support for the technical strategies. The returns obtained from these strategies are not consistent with four popular null models: the random walk, the AR(1), the GARCH-M, and the Exponential GARCH. Buy signals consistently generate higher returns than sell signals, and further, the returns following buy signals are less volatile than returns following sell signals, and further, the returns following buy signals are less volatile than returns following sell signals. Moreover, returns following sell signals are negative, which is not easily explained by any of the currently existing equilibrium models.
Alpha Highlight:
I’m always interested in anything Josef Lakonishok has written. Why? Well, the “L” in LSV stands for Lakonishok and they managed to create a wonderful business that manages around $100 billion. Not bad.
Lakonishok and his coauthors were academics well ahead of their time. Their paper on simple moving average trading rules was published in the Journal of Finance in 1992. What makes this feat even more amazing is that they were publishing papers in top academic journals on technical trading rules in an environment that was extremely hostile towards all things “chartist.”
A quote from Burt Malkiel’s 1981 Random Walk Down Wall Street says it all:
Obviously, I am biased against the “chartist.” This is not only a personal predilection, but a professional one as well. Technical analysis is anathema to the academic world. We love to pick on it. Our bullying tactics’ are prompted by two considerations: (1) the method is patently false; and (2) it’s easy to pick on. And while it may seem a bit unfair to pick on such a sorry target, just remember: His your money we are trying to save.
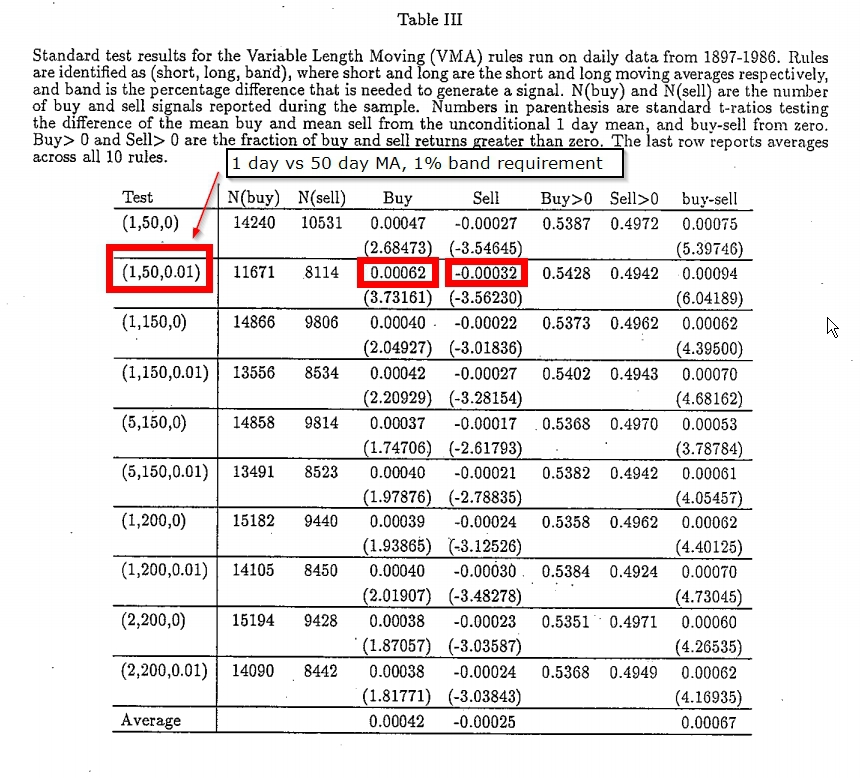
The results of the study are below.

The results are hypothetical results and are NOT an indicator of future results and do NOT represent returns that any investor actually attained. Indexes are unmanaged, do not reflect management or trading fees, and one cannot invest directly in an index. Additional information regarding the construction of these results is available upon request.
The authors find that moving average trading rules work pretty well. The best performing rule is actually the 50-day moving average. They also identify that a 1% trading band improves the trading rule across the board.
As a value-investor by nature, reading papers on technical analysis can be a bit gut-wrenching, however, as an evidence-based investor by faith, the results are interesting!
Old School Evidence on a New School Trading Theme
About the Author: Wesley Gray, PhD
—
Important Disclosures
For informational and educational purposes only and should not be construed as specific investment, accounting, legal, or tax advice. Certain information is deemed to be reliable, but its accuracy and completeness cannot be guaranteed. Third party information may become outdated or otherwise superseded without notice. Neither the Securities and Exchange Commission (SEC) nor any other federal or state agency has approved, determined the accuracy, or confirmed the adequacy of this article.
The views and opinions expressed herein are those of the author and do not necessarily reflect the views of Alpha Architect, its affiliates or its employees. Our full disclosures are available here. Definitions of common statistics used in our analysis are available here (towards the bottom).
Join thousands of other readers and subscribe to our blog.

