The Long-Term Price-Earnings Ratio
- Anderson and Brooks
- A version of the paper can be found here.
- Want a summary of academic papers with alpha? Check out our Academic Research Recap Category.
Abstract:
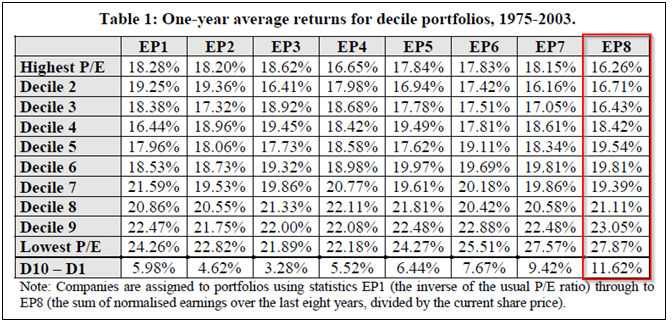
The price-earnings effect has been thoroughly documented and widely studied around the world. However, in existing research it has almost exclusively been calculated on the basis of the previous year’s earnings. We show that the power of the effect has until now been seriously underestimated, due to taking too short-term a view of earnings. We look at all UK companies since 1975, and using the traditional P/E ratio we find the difference in average annual returns between the value and glamour deciles to be 6%, similar to other authors’ findings. We are able to almost double the value premium by calculating P/E ratios using earnings averaged over the last eight years. Averaging, however, implies equal weights for each past year. We further enhance the premium by optimising the weights of the past years of earnings in constructing the P/E ratio.
Core Idea:
The paper finds that multiple years of earnings are a better predictor of returns than the traditional one-year P/E, and that the average of the earnings over of the previous 8 years (EP8) is almost twice as effective as using last year’s earnings (EP1). The concept used is similar to Robert Shiller’s Cyclically Adjusted P/E or “CAPE,” which compares historical S&P earnings from the previous 10 years to current market prices. The idea is that looking at the longer-term record of some fundamental signal “normalizes” it, and reduces the noisiness of recent observations.
This paper examines UK data from 1975-2003.
Key results are as follows:
- Adding more years increases the power of the P/E ratio to predict returns, although not monotonically.
- The Sharpe Ratio was particularly good for the EP7 and EP8 value deciles, offering an excess return to standard deviation ratio more than twice as high as that for the EP1 glamour decile.
Alpha Highlight:
The results are hypothetical results and are NOT an indicator of future results and do NOT represent returns that any investor actually attained. Indexes are unmanaged, do not reflect management or trading fees, and one cannot invest directly in an index. Additional information regarding the construction of these results is available upon request
Note that this paper uses data from the UK; by contrast, Gray and Vogel 2013, using data from the US, were unable to replicate these results. Gray and Vogel show that longer term ratios do not work for US Equity, and that one-year valuation metrics are superior. Thus, it may be that the observed effect is not robust across markets.

About the Author: Wesley Gray, PhD
—
Important Disclosures
For informational and educational purposes only and should not be construed as specific investment, accounting, legal, or tax advice. Certain information is deemed to be reliable, but its accuracy and completeness cannot be guaranteed. Third party information may become outdated or otherwise superseded without notice. Neither the Securities and Exchange Commission (SEC) nor any other federal or state agency has approved, determined the accuracy, or confirmed the adequacy of this article.
The views and opinions expressed herein are those of the author and do not necessarily reflect the views of Alpha Architect, its affiliates or its employees. Our full disclosures are available here. Definitions of common statistics used in our analysis are available here (towards the bottom).
Join thousands of other readers and subscribe to our blog.