Decomposing the Price-Earning Ratio
- Anderson and Brooks
- A version of the paper can be found here.
- Want a summary of academic papers with alpha? Check out our Academic Research Recap Category.
Abstract:
The price-earnings ratio is a widely used measure of the expected performance of companies, and it has almost invariably been calculated as the ratio of the current share price to the previous year’s earnings. However, the P/E of a particular stock is partly determined by outside influences such as the year in which it is measured, the size of the company, and the sector in which the company operates. Examining all UK companies since 1975, we propose a modified price-earnings ratio that decomposes these influences. We then use a regression to weight the factors according to their power in predicting returns. The decomposed price-earnings ratio is able to double the gap in annual returns between the value and glamour deciles, and thus constitutes a useful tool for value fund managers and hedge funds.
Core Idea:
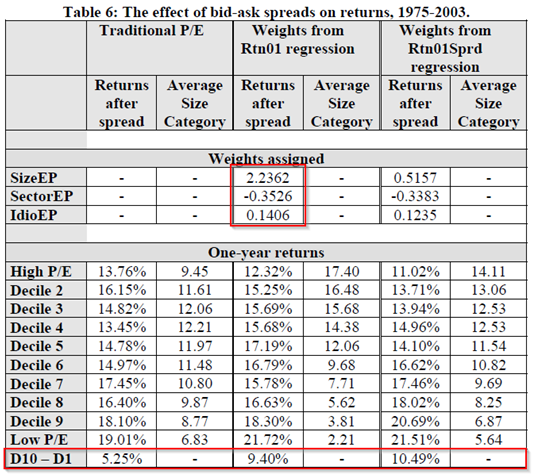
The paper decomposes P/E ratio into 4 factors, and then uses a regression to find the optimal weights of the factors according to their power in predicting returns:
- Time effects (average market P/E varies year by year);
- Sector effects (sectors grow at different rates over time);
- Size effects (positive relationship between a company’s market cap and the P/E);
- Idiosyncratic effects (e.g., insider buying/selling, analysts recommendations).
Alpha Highlight:
- Using the optimum weightings doubles the average annual difference in returns between glamour and value deciles from 5.25% to 10.5%.
- The new value portfolio constructed based on weighted P/E bracket outperforms the old by 2.4% annually.

The results are hypothetical results and are NOT an indicator of future results and do NOT represent returns that any investor actually attained. Indexes are unmanaged, do not reflect management or trading fees, and one cannot invest directly in an index. Additional information regarding the construction of these results is available upon request.
An interesting idea, but anytime results are shown with “optimal” weights, we tend to proceed with caution, as the optimal weight today may not be the optimal weight tomorrow.
About the Author: Wesley Gray, PhD
—
Important Disclosures
For informational and educational purposes only and should not be construed as specific investment, accounting, legal, or tax advice. Certain information is deemed to be reliable, but its accuracy and completeness cannot be guaranteed. Third party information may become outdated or otherwise superseded without notice. Neither the Securities and Exchange Commission (SEC) nor any other federal or state agency has approved, determined the accuracy, or confirmed the adequacy of this article.
The views and opinions expressed herein are those of the author and do not necessarily reflect the views of Alpha Architect, its affiliates or its employees. Our full disclosures are available here. Definitions of common statistics used in our analysis are available here (towards the bottom).
Join thousands of other readers and subscribe to our blog.

