The 52-Week High and Momentum Investing
- Thomas J. George and Chuan-Yang Hwang
- A version of the paper can be found here.
- Want a summary of academic papers with alpha? Check out our Academic Research Recap Category!
Abstract:
When coupled with a stock’s current price, a readily available piece of information—the 52-week high price–explains a large portion of the profits from momentum investing. Nearness to the 52-week high dominates and improves upon the forecasting power of past returns (both individual and industry returns) for future returns. Future returns forecast using the 52-week high do not reverse in the long run. These results indicate that short-term momentum and long-term reversals are largely separate phenomena, which presents a challenge to current theory that models these aspects of security returns as integrated components of the market’s response to news.
Alpha Highlight:
The 52-Week High is widely reported and readily available to investors. But do investors respond rationally to this piece of information?
Several weeks ago we posted an article related to this issue: The Remarkable Truth about 52-Week High Stocks.
Investors may react irrationally to 52-Week High signals because of anchoring and framing biases. For example, irrational investors may take the 52-week high metric as a signal to sell without considering the fact that the current price may undervalue the security on a fundamental basis.
In this paper, the authors offer a new look at the 52-week high signal. Here are the main conclusions:
- Profits to a momentum strategy based on nearness to the 52-week high are superior to traditional momentum strategies based on the returns over a fixed-length interval in the past;
- Future returns based on 52-week high do not reverse in the long run, unlike reversals observed in many momentum studies;
- Nearness to 52-week high is a much better predictor of future returns than are past returns (momentum) alone; this is true regardless of whether these 52-week high stocks have earned extreme past returns.
The behavioral-based explanations for these results:
When good news has pushed a stock’s price near or to a new 52-week high, traders are reluctant to bid the price of the stock higher even if the information warrants it. The information eventually prevails and the price moves up, resulting in a continuation. Similarly, when bad news pushes a stock’s price far from its 52-week high, traders are initially unwilling to sell the stock at prices that are as low as the information implies. The information eventually prevails and the price falls.
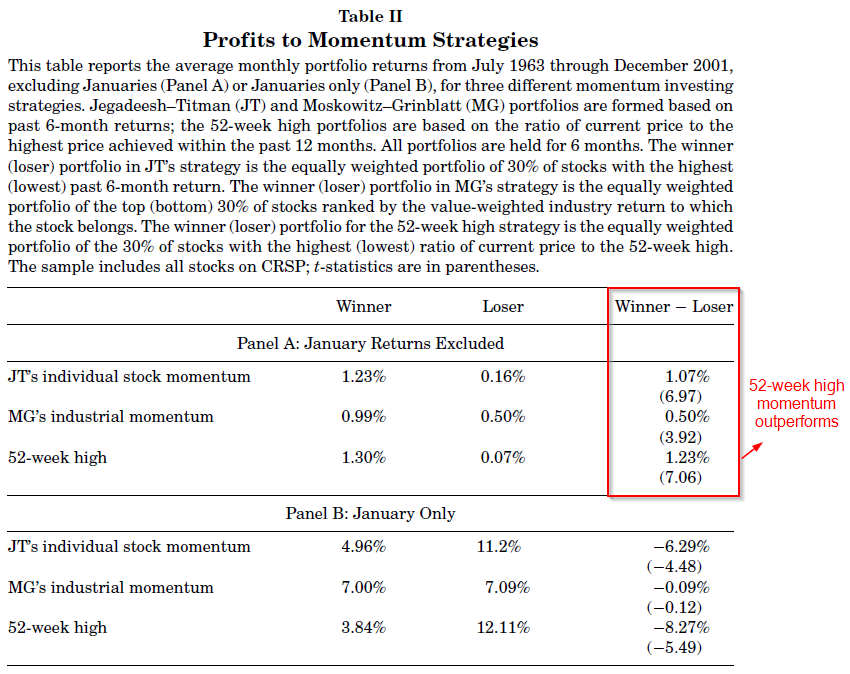
The paper compares 3 momentum strategies based on all Nasdaq/AMEX/NYSE stocks from 1963 to 2001:
- Jegadeesh and Titmans’s (JT’s) individual stock momentum: Take long (short) positions in the 30% top (bottom) performing stocks (proposed by Jegadeesh and Titman (1993));
- Moskowitz and Grinblatt’s (MG’s) industrial momentum: Take long (short) positions in stocks in the 30% top (bottom) performing industries (proposed by Moskowitz and Grinblatt (1999);
- 52-week high momentum: Take long (short) positions in stocks whose current price is close to (far from) the 52-week high, which can be measure by P(i,t-1)/High(i,t-1).
Main Charts and Core findings:
Table II shows the performance of these three strategies. The 52-week high momentum strategy performs the best.

The results are hypothetical results and are NOT an indicator of future results and do NOT represent returns that any investor actually attained. Indexes are unmanaged, do not reflect management or trading fees, and one cannot invest directly in an index. Additional information regarding the construction of these results is available upon request.
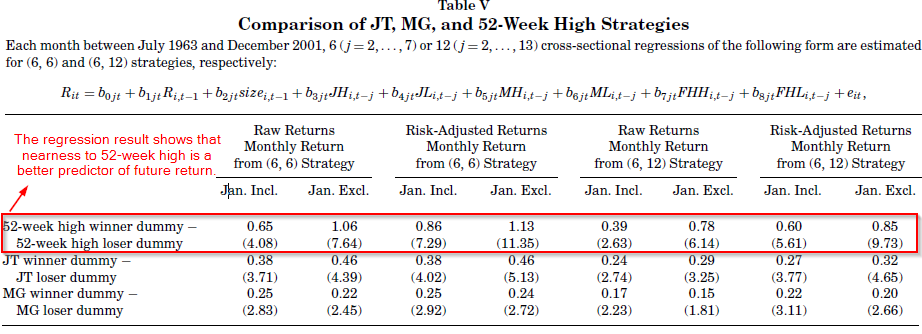
The paper also investigates which strategy above dominates, after controlling for firm size and bid-ask bounce, and thus drives returns, both raw and risk adjusted. Regression results form Table V show that 52-week high winner/loser dummy is a good predictor of future return–better than the past stock returns or industry factors.

The results are hypothetical results and are NOT an indicator of future results and do NOT represent returns that any investor actually attained. Indexes are unmanaged, do not reflect management or trading fees, and one cannot invest directly in an index. Additional information regarding the construction of these results is available upon request.
Jegadeesh and Titman’s groundbreaking work in momentum is now fairly widely accepted and understood: extreme past returns seem to have some predictive power for future stock prices. This research suggests a stunning corollary: although 52-week high stocks must have some momentum (otherwise they wouldn’t be 52-week high stocks), the fact that these stocks are at 52-week highs predicts future returns regardless of whether their past returns were extreme or not. That is, the price level, relative to a reference point (the 52-week high), seems in this context to be an even more powerful price predictor than momentum in isolation. And while reversals do occur for momentum stocks, 52-week high stocks do not reverse.
Very interesting in general. However, these observations should perhaps be accompanied by some caveats. For example, this research includes many small and/or microcap stocks, which might tend to skew the results versus what could be achieved in the real world. Additionally, Jegadeesh and Titman’s momentum returns are based on fairly wide swaths of momentum stocks, suggesting that more concentrated positions could potentially enhance momentum returns beyond those examine here. Nevertheless, these observations are powerful evidence of an anchoring or framing effect caused by 52-week highs that exists, perhaps somewhat independently of momentum.
About the Author: Wesley Gray, PhD
—
Important Disclosures
For informational and educational purposes only and should not be construed as specific investment, accounting, legal, or tax advice. Certain information is deemed to be reliable, but its accuracy and completeness cannot be guaranteed. Third party information may become outdated or otherwise superseded without notice. Neither the Securities and Exchange Commission (SEC) nor any other federal or state agency has approved, determined the accuracy, or confirmed the adequacy of this article.
The views and opinions expressed herein are those of the author and do not necessarily reflect the views of Alpha Architect, its affiliates or its employees. Our full disclosures are available here. Definitions of common statistics used in our analysis are available here (towards the bottom).
Join thousands of other readers and subscribe to our blog.

