Financial Intermediaries and the Cross-Section of Asset Returns
- Adrian, Etula and Muir
- A version of the paper can be found here.
- Want a summary of academic papers with alpha? Check out our Academic Research Recap Category.
Abstract:
Financial intermediaries trade frequently in many markets using sophisticated models. Their marginal value of wealth should therefore provide a more informative stochastic discount factor (SDF) than that of a representative consumer. Guided by theory, we use shocks to the leverage of securities broker-dealers to construct an intermediary SDF. Intuitively, deteriorating funding conditions are associated with deleveraging and high marginal value of wealth. Our single-factor model prices size, book-to-market, momentum, and bond portfolios with an R2 of 77% and an average annual pricing error of 1%—performing as well as standard multifactor benchmarks designed to price these assets.
Alpha Highlight:
Financial intermediaries, such as broker-dealers, trade with high frequency, low transaction cost, and based on sophisticated models. Adjustments to broker-leader leverage is thus a signal of changes in the underlying economic conditions in the economy.
In this paper, the authors provide empirical evidence that risk exposure to broker-dealer leverage shocks can explain cross-sectional return premiums. Value, size, beta, momentum, be damned…
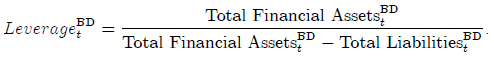
First, Broker-dealer (BD) leverage is calculated as follows:
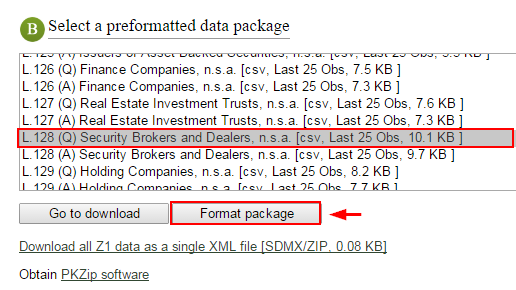
Data can be found from Table L.128 (Q) “Security Brokers and Dealers” in Z.1 “Financial Accounts of the United States” report published by Federal Reserve Website. The data is released during the second week of March, June, September, and December. Below graph shows the download page: Step 1, Select L. 128 (Q); Step 2, Choose Format package to choose time period. Click here to download data.
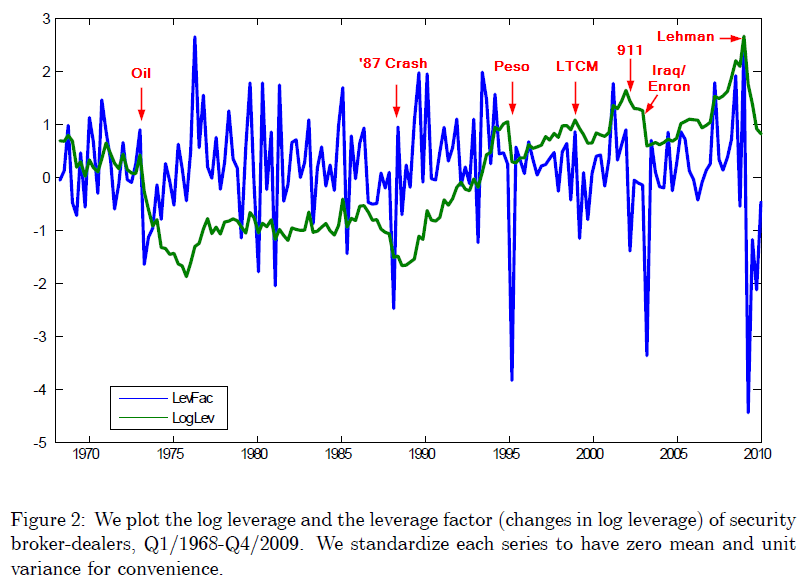
The graph below from the paper indicates that during crisis, volatility and margin requirements increase, which may push broker-dealers to reduce leverage.
The results are hypothetical results and are NOT an indicator of future results and do NOT represent returns that any investor actually attained. Indexes are unmanaged, do not reflect management or trading fees, and one cannot invest directly in an index. Additional information regarding the construction of these results is available upon request.
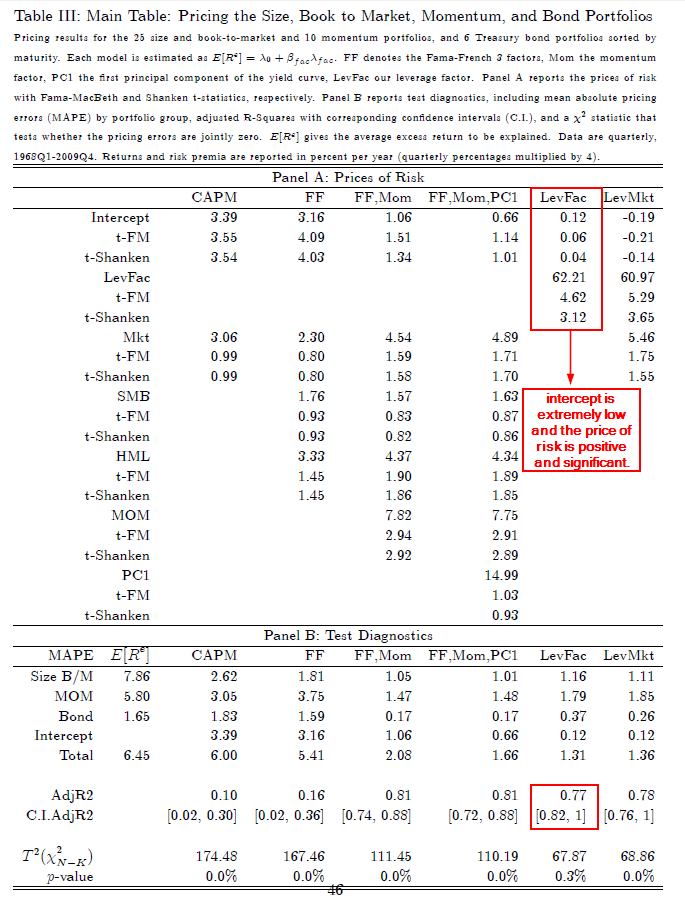
Next the paper creates a broker-dealer leverage factor, which describes the “shock” to log leverage (seasonally adjusted). The paper predicts that this factor will explain differences in returns across assets. The authors test their factor on 41 test assets: 25 size and B/M portfolios, 10 momentum portfolios, and 6 bond portfolios.
![]()
Key findings:
The broker-dealer leverage risk factor outperforms CAPM, FF, FF+Mom, and other multi-factor models.
The results are hypothetical results and are NOT an indicator of future results and do NOT represent returns that any investor actually attained. Indexes are unmanaged, do not reflect management or trading fees, and one cannot invest directly in an index. Additional information regarding the construction of these results is available upon request.
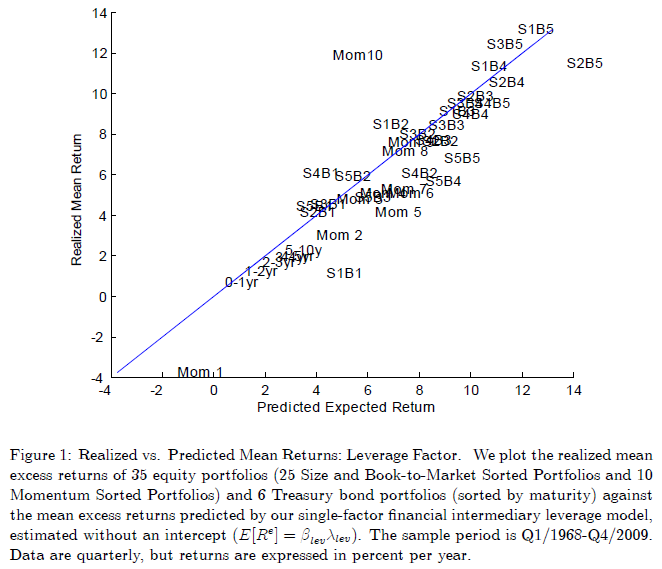
How does the model price various portfolio sorts?
Besides the highest momentum portfolio (Mom 10), the test assets line up very close to 45-degree line. –> good prediction!
The results are hypothetical results and are NOT an indicator of future results and do NOT represent returns that any investor actually attained. Indexes are unmanaged, do not reflect management or trading fees, and one cannot invest directly in an index. Additional information regarding the construction of these results is available upon request.

About the Author: Wesley Gray, PhD
—
Important Disclosures
For informational and educational purposes only and should not be construed as specific investment, accounting, legal, or tax advice. Certain information is deemed to be reliable, but its accuracy and completeness cannot be guaranteed. Third party information may become outdated or otherwise superseded without notice. Neither the Securities and Exchange Commission (SEC) nor any other federal or state agency has approved, determined the accuracy, or confirmed the adequacy of this article.
The views and opinions expressed herein are those of the author and do not necessarily reflect the views of Alpha Architect, its affiliates or its employees. Our full disclosures are available here. Definitions of common statistics used in our analysis are available here (towards the bottom).
Join thousands of other readers and subscribe to our blog.