Executive Summary:
Dual Momentum, a concept pioneered by Gary Antonacci, intelligently combines elements of two types of momentum investing strategies — absolute and relative momentum — into a comprehensive asset allocation system. His paper shows that the combination of time-series momentum and cross-sectional momentum has generate intriguing results historically.
In this article, we investigate the Dual Momentum strategy and compare it to the timing elements utilized in the Robust Asset Allocation (RAA) strategy. The RAA strategy was developed in conjunction with our FACTS framework and has a simple goal: A low-cost, low-complexity, high-liquidity, diversified, tax-efficient, risk-managed retirement portfolio.
We find that the robust asset allocation (RAA) matches–and arguably beats–the performance of a Dual Momentum approach (DUAL MOM).
The bottom line is that both systems are worth a look. However, given our preference for keeping things as simple as possible, in our view, RAA wins the asset allocation horserace.
1. Background:
Before we start the horserace, let’s meet the horses and walk through the rules of our race.
Momentum strategies have been studied for decades in both practice and academia. Momentum strategies are robust across different time periods and also across different asset classes (equities, bonds, commodities, real estate, and so forth), making them a good choice for asset allocation.
There is sometimes a lot of confusion associated with so-called “momentum” strategies, and people interpret and apply them in many different ways. We break momentum into two categories below to differentiate between common approaches to implementing “momentum.”
(1) Absolute, or time-series momentum: an asset classes’ own past return, considered independently from the returns of other asset classes, predicts its future performance. This could apply at the level of individual securities as well.
(2) Relative Strength, or Cross-sectional momentum: an asset classes’ performance, relative to other asset classes, predicts its future relative performance. This could also apply at the individual security level, when performance is compared versus the performance of comparable securities; thus, the term is not exclusive to “asset classes.”
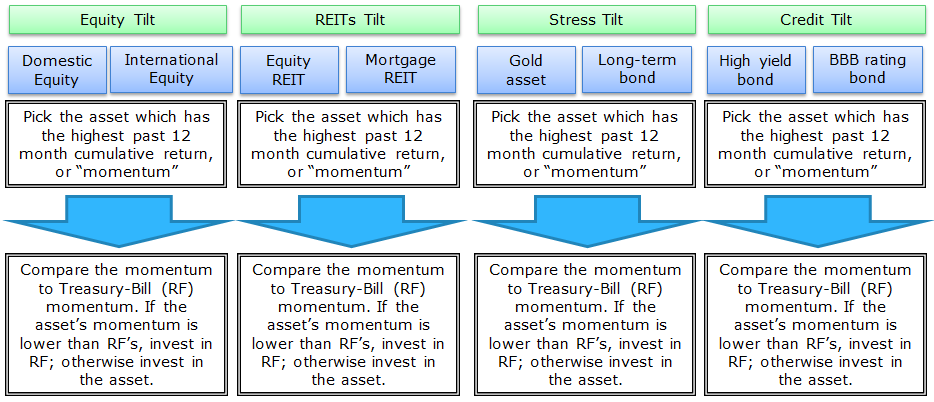
1.1 Dual Momentum Strategy
Step 1: Calculate Relative Momentum within an Asset Pair (RMOM)
- Pick the asset with the highest relative performance over the past 12 months
Step 2: Time Series Momentum Rule (TSMOM) on RMOM asset
- Excess Return = total return over past 12 months less return of T-bill
- If Excess return > 0, go long risky assets. Otherwise, go to alternative assets (T-bills)
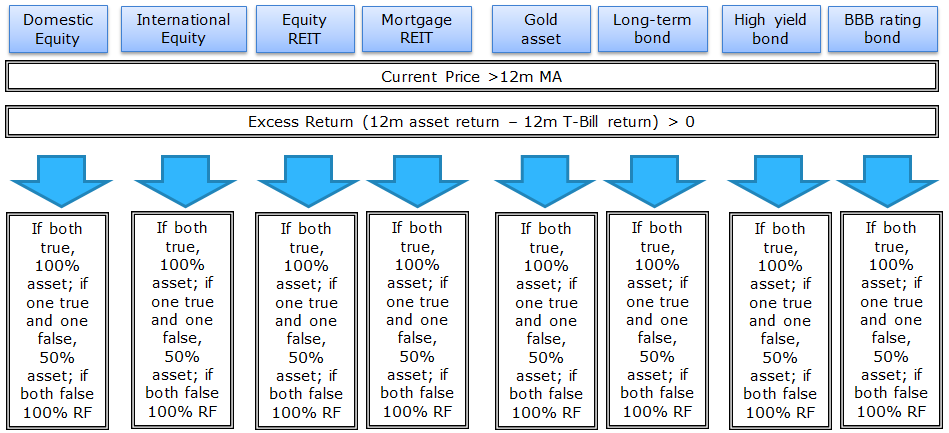
1.2 Robust Asset Allocation (RAA):
The Robust Asset Allocation (RAA) framework is risk-managed with a combination of 50% TSMOM and 50% MA. Here is our full article about RAA.
- 50% Time Series Momentum Rule (TSMOM)
- Excess return = total return over past 12 months less return of T-bill
- If Excess return >0, go long risky assets. Otherwise, go alternative assets (T-Bills)
- 50% Simple Moving Average Rule (MA)
- Moving Average (12) = average 12 month prices
- If Current Price – Moving Average (12) > 0, go long risky assets. Otherwise, go alternative assets (T-bills).
2. RAA and Dual MOM Horserace By Asset Pair
Our simulated historical period is from 1/1/1977 to 7/31/2014 for the Equity, REIT, and Stress pairs, and 1/1/1986 to 7/31/2014 for the Credit pair. Results are gross, no fees are included, and only index returns are included. Indexes are unmanaged, do not reflect management or trading fees, and one cannot invest directly in an index. All returns are total returns and include the reinvestment of distributions (e.g., dividends). Strategies are all monthly-rebalanced.
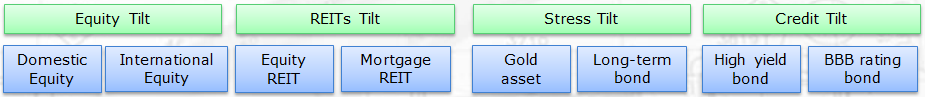
Below are the 8 asset classes (4 pairs), and the ROBUST system:
- SP500 = S&P 500 Total Return Index
- EAFE= MSCI EAFE Total Return Index
- Equity REIT = FTSE NAREIT All Equity REITS Total Return Index
- Mortgage REIT = FTSE NAREIT All Mortgage REITS Total Return Index
- LTR = The Merrill Lynch 10-year U.S. Treasury Futures Total Return Index
- GOLD = London Gold Market PM Fixing index
- High Yield Bond = Bank of America Merrill Lynch U.S. Cash Pay High Yield Index
- BBB US corporate = The BofA Merrill Lynch 3-5 Year A-BBB US Corporate Index
- ROBUST = 50% MA and 50% TMOM
When analyzing the 4 pairs in the ROBUST system, we do the following. Every month, assume a 50/50 split between the 2 assets. In equity, we would assume 50% SP500 and 50% EAFE. We then assess the risk-management rules on the two assets using 50% time-series momentum and 50% moving-average rules. If the risk-management rules state to be “out” of one of the pairs, we take that portion and invest in RF.
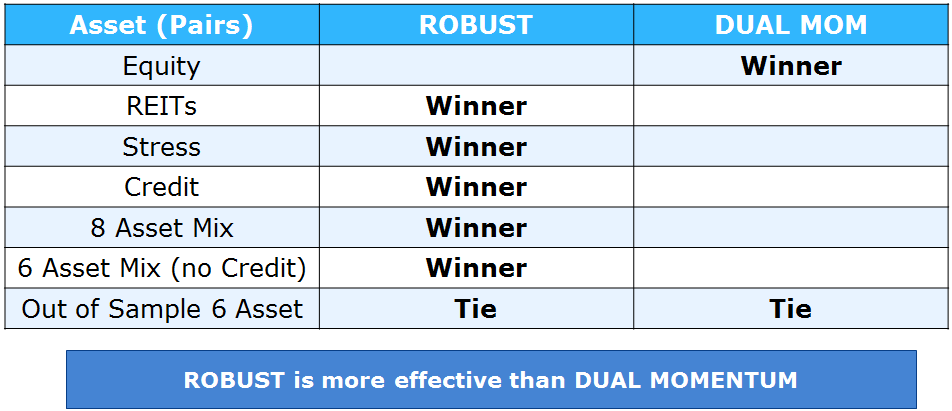
We assessed the historical “winner” based on a combination of Sharpe and Sortino Ratios. If the Sharpe and Sortino were both better it was a clear win; If the Sharpe and Sortino were mixed it was deemed a tie. Let’s take a peak at the results:

Next, here is the detailed analysis:
2.1 Equity Assets Summary Statistics
We assess the Domestic Equity (SP500) and International Equity (EAFE) pair from 1/1/1977 to 7/31/2014.
- DUAL MOM outperforms ROBUST.
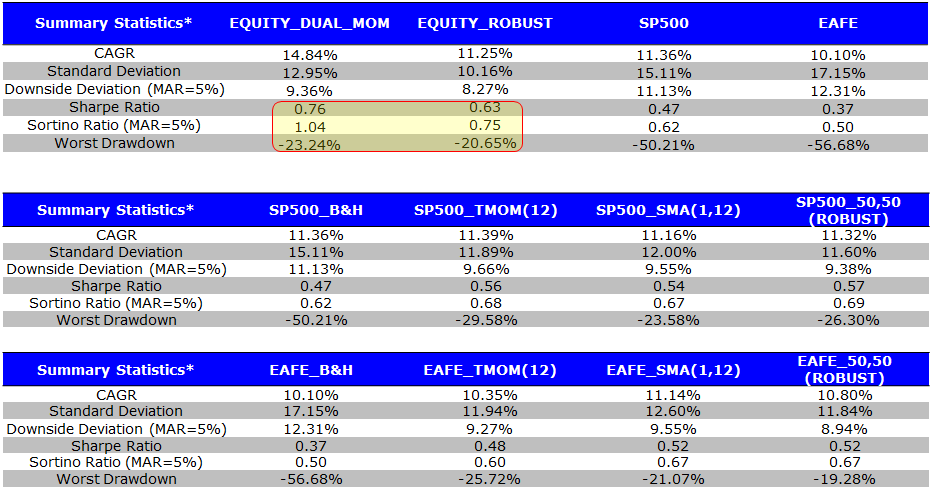
The results are hypothetical results and are NOT an indicator of future results and do NOT represent returns that any investor actually attained. Indexes are unmanaged, do not reflect management or trading fees, and one cannot invest directly in an index. Additional information regarding the construction of these results is available upon request.
2.2 REIT ASSETs SUMMARY STATISTICS
We assess the Equity REIT and Mortgage REIT pair from 1/1/1977 to 7/31/2014.
- ROBUST Outperforms DUAL MOM.
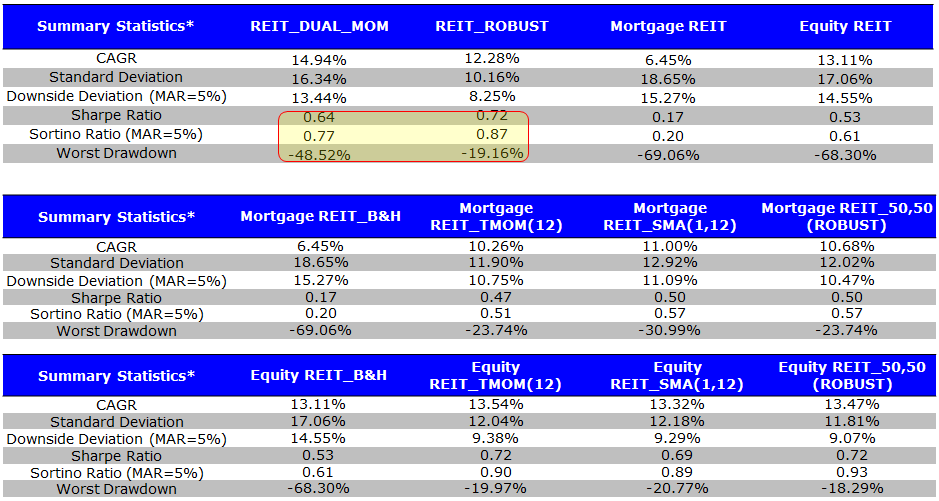
The results are hypothetical results and are NOT an indicator of future results and do NOT represent returns that any investor actually attained. Indexes are unmanaged, do not reflect management or trading fees, and one cannot invest directly in an index. Additional information regarding the construction of these results is available upon request.
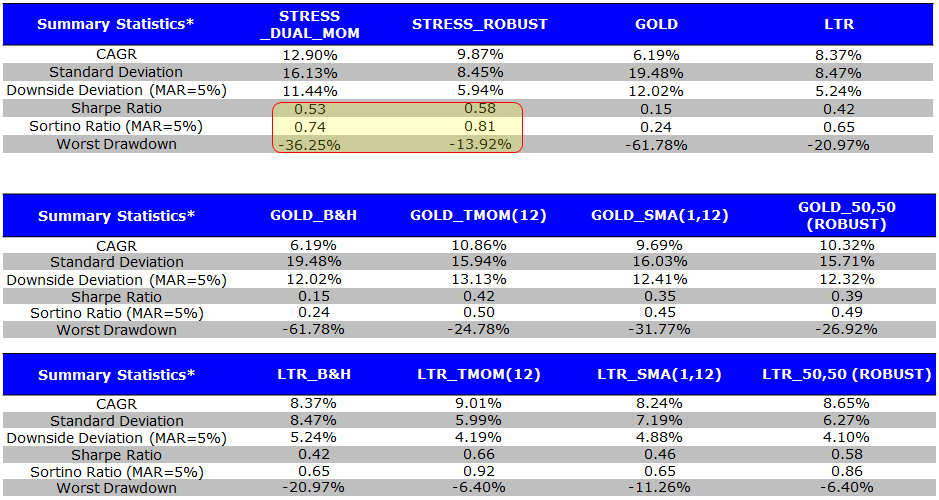
2.3 Stress ASSETS SUMMARY STATISTICS
We assess the Gold Asset and Long-term Bond (LTR) pair from 1/1/1977 to 7/31/2014.
- ROBUST Outperforms DUAL MOM.
The results are hypothetical results and are NOT an indicator of future results and do NOT represent returns that any investor actually attained. Indexes are unmanaged, do not reflect management or trading fees, and one cannot invest directly in an index. Additional information regarding the construction of these results is available upon request.
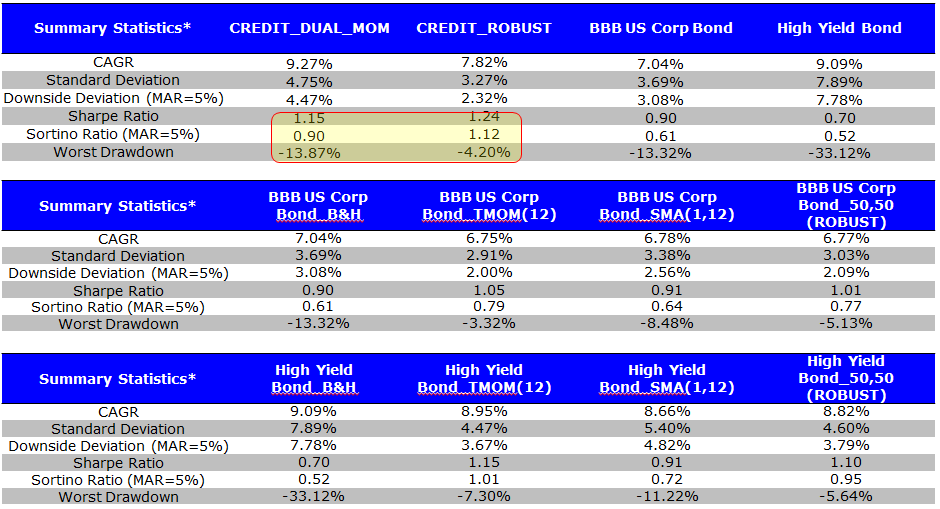
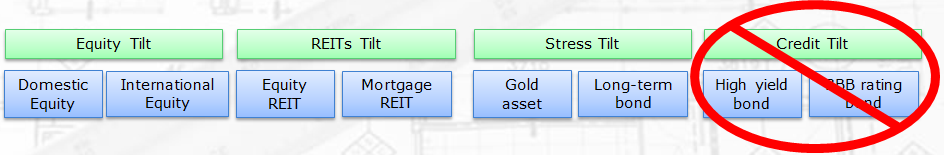
2.4 Credit ASSETS SUMMARY STATISTICS
We assess the High Yield Bond and BBB-rating Bond pair from 1/1/1986 to 7/31/2014.
- ROBUST Outperforms DUAL MOM.
The results are hypothetical results and are NOT an indicator of future results and do NOT represent returns that any investor actually attained. Indexes are unmanaged, do not reflect management or trading fees, and one cannot invest directly in an index. Additional information regarding the construction of these results is available upon request.
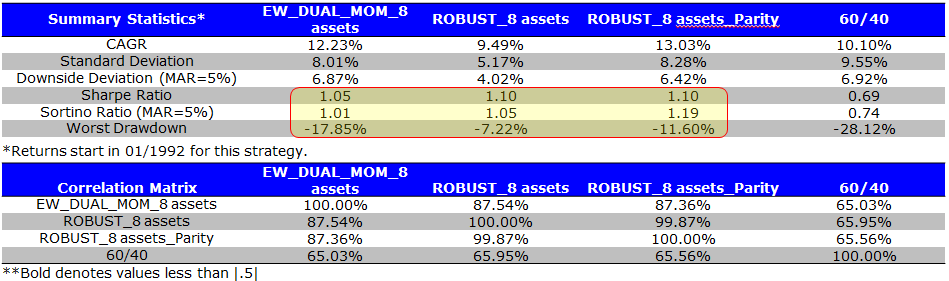
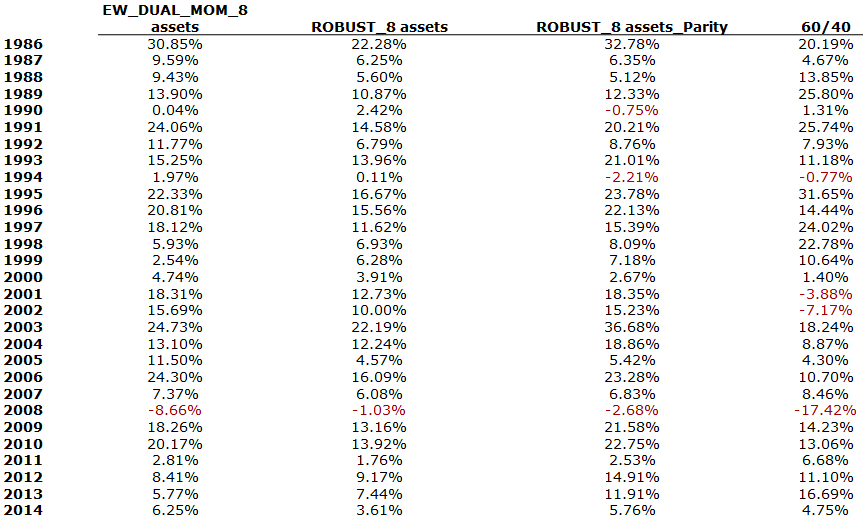
3. RAA and Dual MOM Horserace with 8 Assets
In this section, we apply ROBUST and DUAL MOM to the 8 assets and our simulated historical period is from 1/1/1986 to 7/31/2014. Results are gross, no fees are included and only index returns are included. Indexes are unmanaged, do not reflect management or trading fees, and one cannot invest directly in an index. All returns are total returns and include the reinvestment of distributions (e.g., dividends). Strategies are all monthly-rebalanced.
Below is the legend:
- EW_DUAL_MOM_8 = Dual momentum applied on all 8 asset classes (4 pairs)
- ROBUST_8_assets = Robust applied on all 8 asset classes
- ROBUST_8_assets_Parity = Robust applied on all 8 asset classes, levered to approximately match volatility of DUAL MOM
- 60/40 = 60% S&P 500 TR Index and 40% 10-Year Treasury Index

3.1 SUMMARY STATISTICS
- ROBUST Outperforms DUAL MOM.
The results are hypothetical results and are NOT an indicator of future results and do NOT represent returns that any investor actually attained. Indexes are unmanaged, do not reflect management or trading fees, and one cannot invest directly in an index. Additional information regarding the construction of these results is available upon request.
The results are hypothetical results and are NOT an indicator of future results and do NOT represent returns that any investor actually attained. Indexes are unmanaged, do not reflect management or trading fees, and one cannot invest directly in an index. Additional information regarding the construction of these results is available upon request.
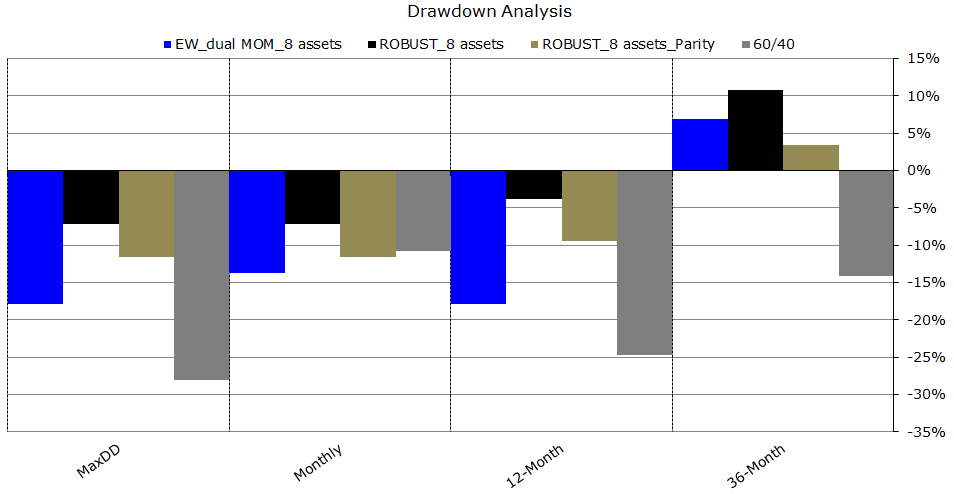
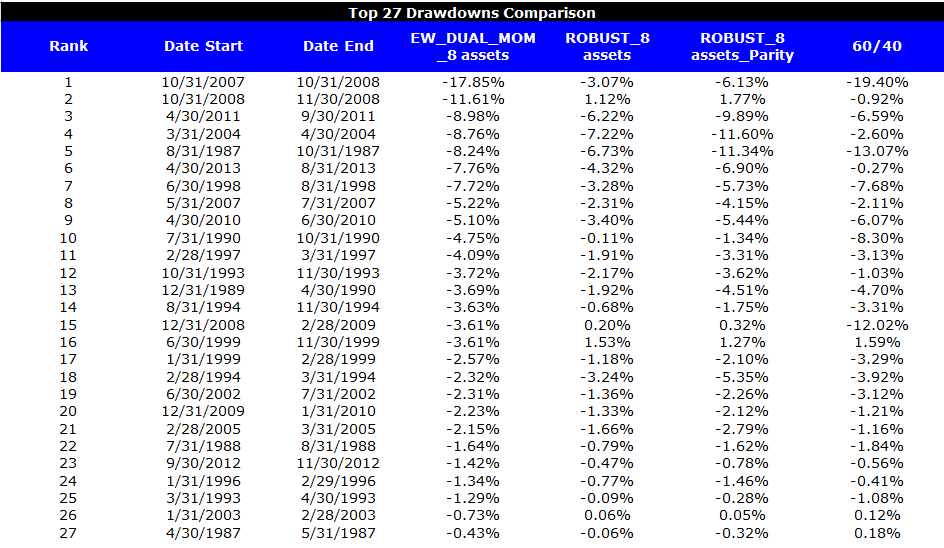
3.2 Drawdown SUMMARY:
- ROBUST has stronger drawdown protection.
The results are hypothetical results and are NOT an indicator of future results and do NOT represent returns that any investor actually attained. Indexes are unmanaged, do not reflect management or trading fees, and one cannot invest directly in an index. Additional information regarding the construction of these results is available upon request.
The results are hypothetical results and are NOT an indicator of future results and do NOT represent returns that any investor actually attained. Indexes are unmanaged, do not reflect management or trading fees, and one cannot invest directly in an index. Additional information regarding the construction of these results is available upon request.
4. RAA and Dual MOM Horserace with 6 Assets
In this section, we apply ROBUST and DUAL MOM on 6 assets (excluding the Credit pair due to data limitations) and our simulated historical period is from 1/1/1977 to 7/31/2014. Results are gross, no fees are included, and only index returns are included. Indexes are unmanaged, do not reflect management or trading fees, and one cannot invest directly in an index. All returns are total returns and include the reinvestment of distributions (e.g., dividends). Strategies are all monthly-rebalanced.
Below is the legend:
- EW_DUAL_MOM_6 = Dual momentum applied on all 6 asset classes (3 pairs)
- ROBUST_6_assets = Robust applied on all 6 asset classes
- ROBUST_6_assets_Parity = Robust applied on all 6 asset classes, levered to approximately match volatility of DUAL MOM
- 60/40 = 60% S&P 500 TR Index and 40% 10-Year Treasury Index
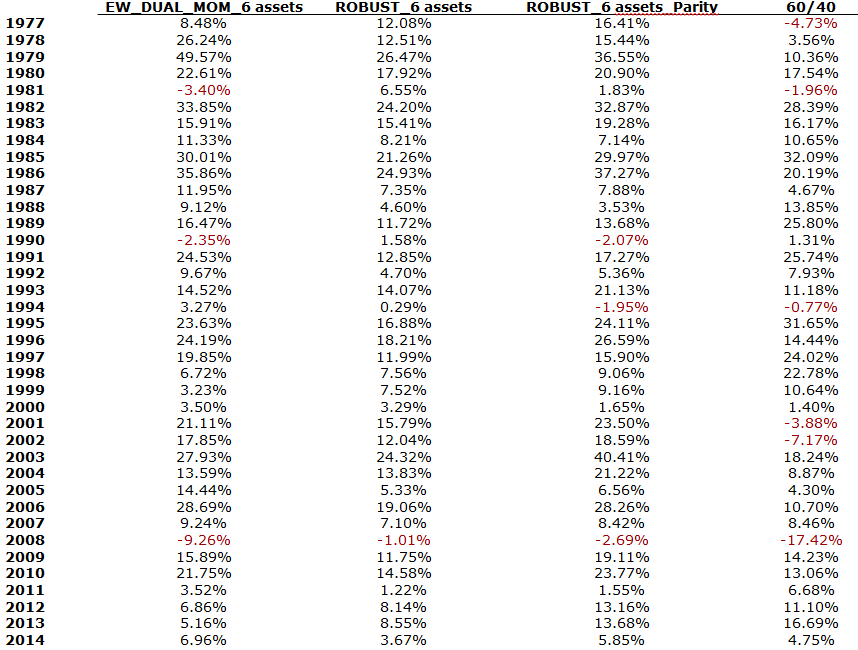
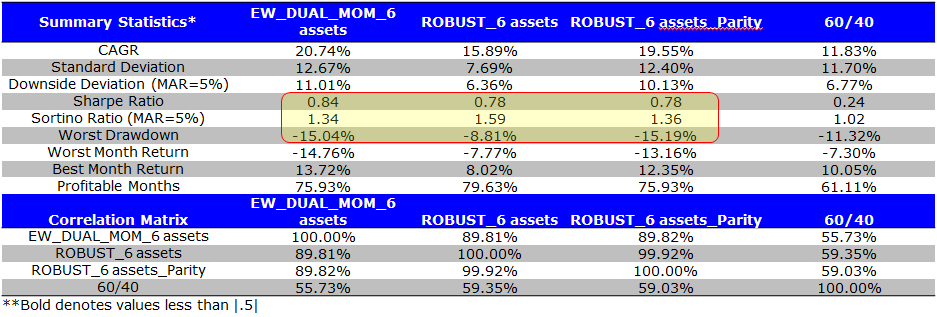
4.1 SUMMARY STATISTICS
- ROBUST Outperforms DUAL MOM.
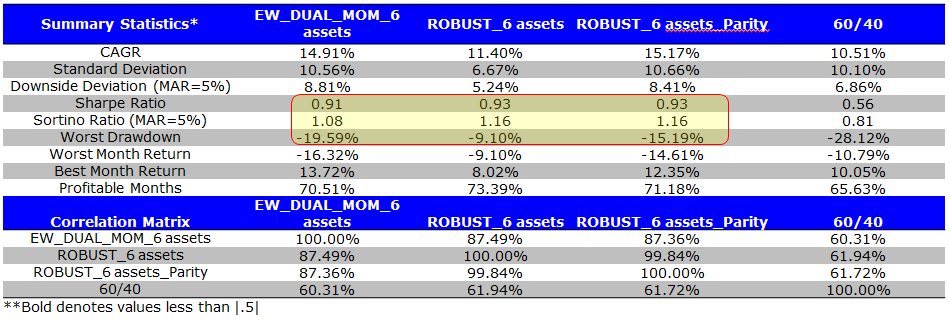
The results are hypothetical results and are NOT an indicator of future results and do NOT represent returns that any investor actually attained. Indexes are unmanaged, do not reflect management or trading fees, and one cannot invest directly in an index. Additional information regarding the construction of these results is available upon request.
The results are hypothetical results and are NOT an indicator of future results and do NOT represent returns that any investor actually attained. Indexes are unmanaged, do not reflect management or trading fees, and one cannot invest directly in an index. Additional information regarding the construction of these results is available upon request.
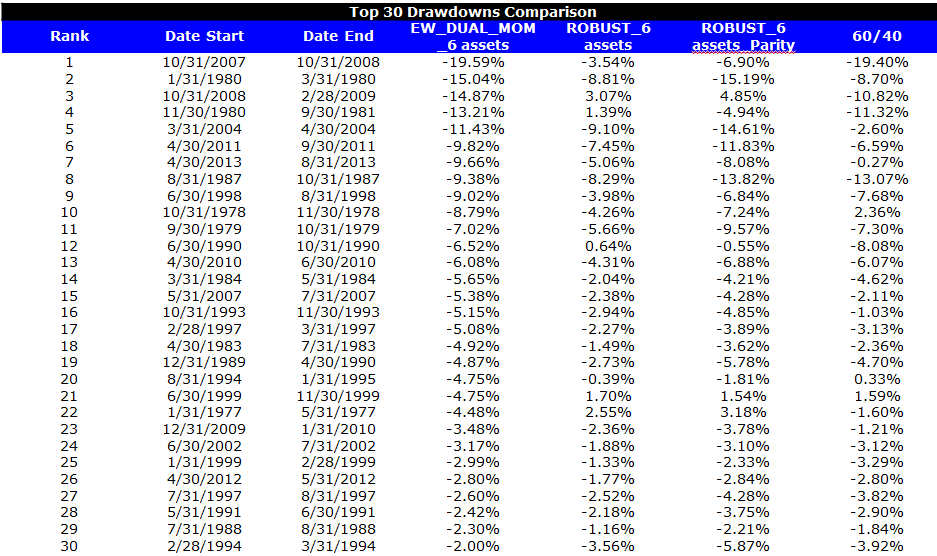
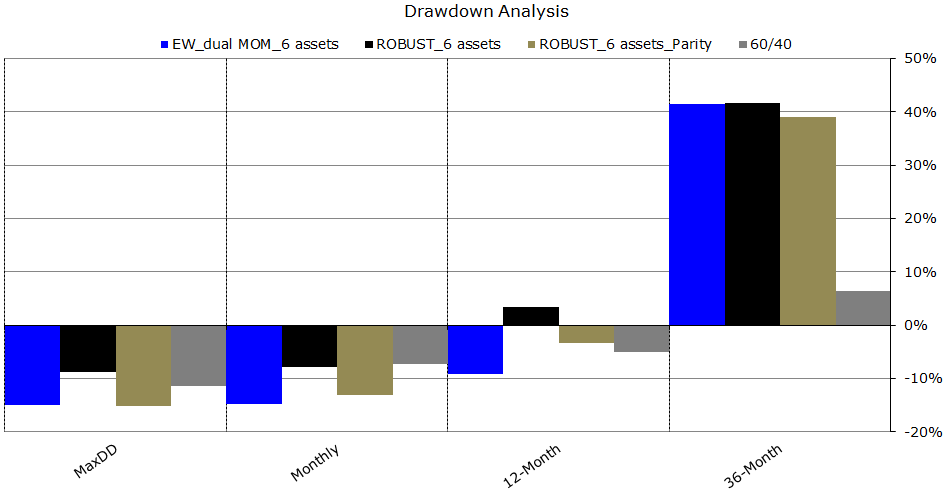
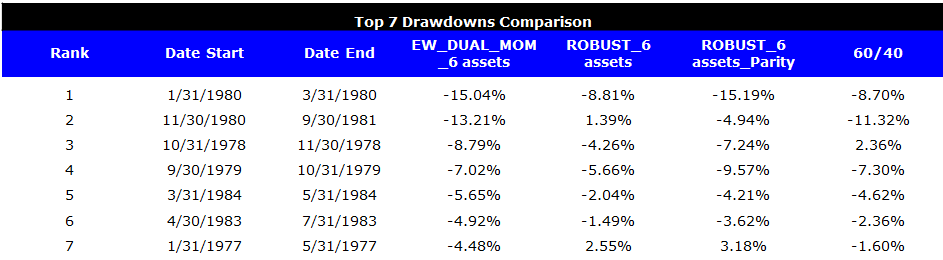
4.2 Drawdown SUMMARY:
- ROBUST has stronger drawdown protection.
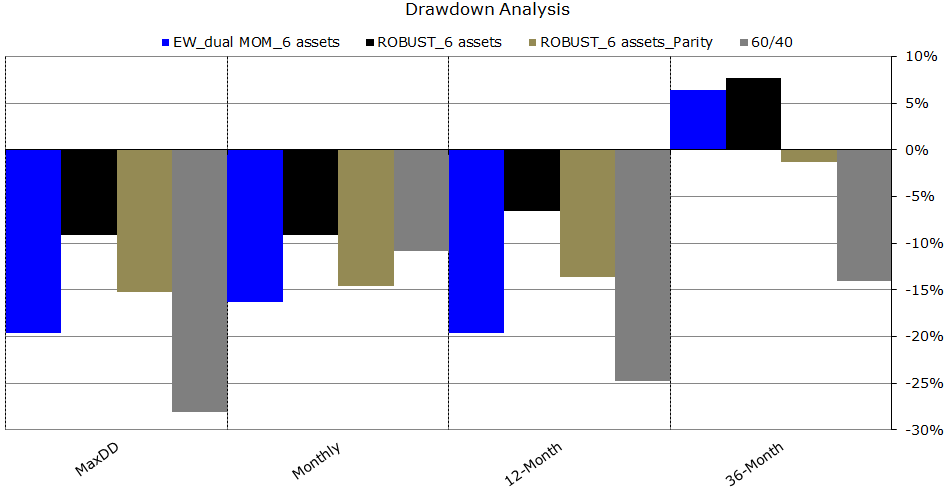
The results are hypothetical results and are NOT an indicator of future results and do NOT represent returns that any investor actually attained. Indexes are unmanaged, do not reflect management or trading fees, and one cannot invest directly in an index. Additional information regarding the construction of these results is available upon request.
The results are hypothetical results and are NOT an indicator of future results and do NOT represent returns that any investor actually attained. Indexes are unmanaged, do not reflect management or trading fees, and one cannot invest directly in an index. Additional information regarding the construction of these results is available upon request.
5. Out of Sample Horserace: 6 Assets, 1977/01 to 1985/12
In this section, we apply ROBUST and DUAL MOM on 6 assets (excluding the Credit pair due to data limitations) and our simulated historical period is from 1/1/1977 to 12/31/1985. Results are gross, no fees are included, and only index returns are included. Indexes are unmanaged, do not reflect management or trading fees, and one cannot invest directly in an index. All returns are total returns and include the reinvestment of distributions (e.g., dividends). Strategies are all monthly-rebalanced.
Below is the legend:
- EW_DUAL_MOM_6 = Dual momentum applied on all 6 asset classes (3 pairs)
- ROBUST_6_assets = Robust applied on all 6 asset classes
- ROBUST_6_assets_Parity = Robust applied on all 6 asset classes, levered to approximately match volatility of DUAL MOM
- 60/40 = 60% S&P 500 TR Index and 40% 10-Year Treasury Index
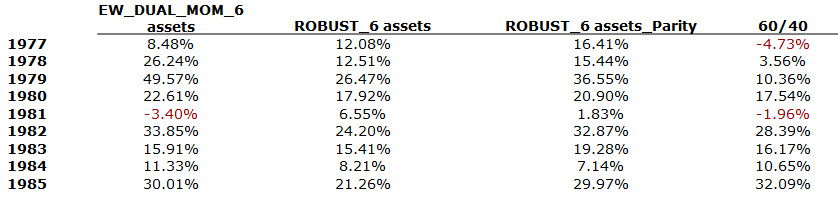
5.1 SUMMARY STATISTICS
- ROBUST is similar to DUAL MOM
The results are hypothetical results and are NOT an indicator of future results and do NOT represent returns that any investor actually attained. Indexes are unmanaged, do not reflect management or trading fees, and one cannot invest directly in an index. Additional information regarding the construction of these results is available upon request.
The results are hypothetical results and are NOT an indicator of future results and do NOT represent returns that any investor actually attained. Indexes are unmanaged, do not reflect management or trading fees, and one cannot invest directly in an index. Additional information regarding the construction of these results is available upon request.
5.2 DRAWDOWN SUMMARY:
- ROBUST has stronger drawdown protection.
The results are hypothetical results and are NOT an indicator of future results and do NOT represent returns that any investor actually attained. Indexes are unmanaged, do not reflect management or trading fees, and one cannot invest directly in an index. Additional information regarding the construction of these results is available upon request.
The results are hypothetical results and are NOT an indicator of future results and do NOT represent returns that any investor actually attained. Indexes are unmanaged, do not reflect management or trading fees, and one cannot invest directly in an index. Additional information regarding the construction of these results is available upon request.
6. Conclusion
At the outset we highlighted that both the DUAL MOM and the ROBUST asset allocation systems are something every investor should investigate. We assessed the historical “winner” based on a combination of Sharpe and Sortino Ratios. Historically, ROBUST has been a better bet than DUAL MOM. Whether this will continue in the future is anyone’s guess…

About the Author: Wesley Gray, PhD
—
Important Disclosures
For informational and educational purposes only and should not be construed as specific investment, accounting, legal, or tax advice. Certain information is deemed to be reliable, but its accuracy and completeness cannot be guaranteed. Third party information may become outdated or otherwise superseded without notice. Neither the Securities and Exchange Commission (SEC) nor any other federal or state agency has approved, determined the accuracy, or confirmed the adequacy of this article.
The views and opinions expressed herein are those of the author and do not necessarily reflect the views of Alpha Architect, its affiliates or its employees. Our full disclosures are available here. Definitions of common statistics used in our analysis are available here (towards the bottom).
Join thousands of other readers and subscribe to our blog.