It appears even the Oracle of Omaha may be vulnerable to short term performance pressures. The
Berkshire report came out today, and it has magically changed formats to deemphasize the fact the book value per share has lagged the S&P 500 for 5 out of the last 6 years.
A pretty terrible streak of book value performance (explained in the opening discussion).
Examining reporting in the Old and New Formats
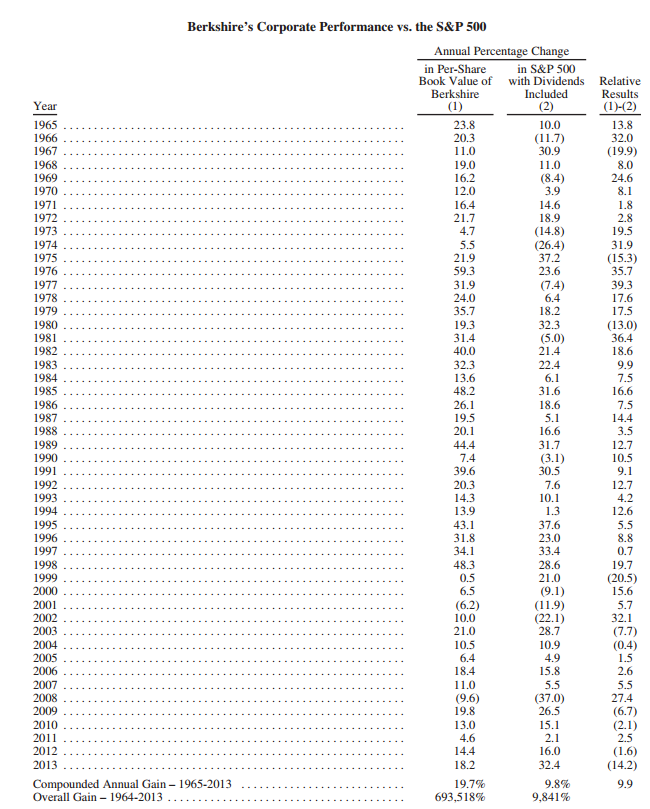
First, a look at Berkshire performance in the “old reporting format,” which is NOT included in this year’s report.
| Old Reporting Format | |||
| 1) Berkshire BV | 2) S&P TR | 1-2 Difference | |
| 2009 | 19.8 | 26.5 | -6.7 |
| 2010 | 13 | 15.1 | -2.1 |
| 2011 | 4.6 | 2.1 | 2.5 |
| 2012 | 14.4 | 16 | -1.6 |
| 2013 | 18.2 | 32.4 | -14.2 |
| 2014 | 8.3 | 13.7 | -5.4 |
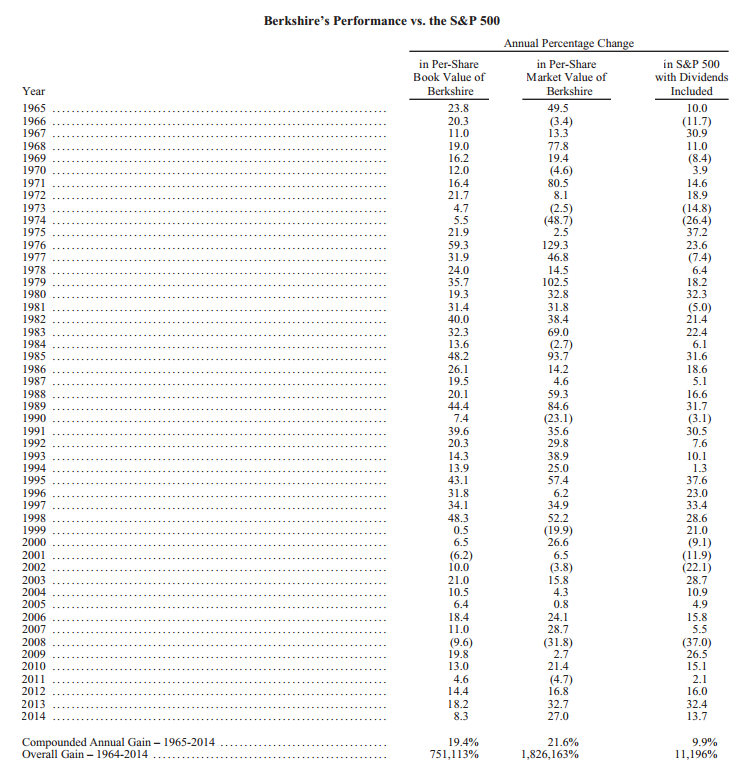
Next, a look at the performance as reported in the “new” format.
| New Reporting Format | |||
| 1) Berkshire BV | 2) Berkshire MV | 2) S&P TR | |
| 2009 | 19.8 | 2.7 | 26.5 |
| 2010 | 13 | 21.4 | 15.1 |
| 2011 | 4.6 | -4.7 | 2.1 |
| 2012 | 14.4 | 16.8 | 16 |
| 2013 | 18.2 | 32.7 | 32.4 |
| 2014 | 8.3 | 27 | 13.7 |
Notice how the difference in reporting changes the flavor of the results?
A few key differences in reporting that shift focus from relative performance:
- No relative results–which would be horrific the past few years!
- Berkshire Market Value included–which looks a lot better than book value performance!
The logic for the change as stated by the Oracle:
During our tenure, we have consistently compared the yearly performance of the S&P 500 to the change in Berkshire’s per-share book value. We’ve done that because book value has been a crude, but useful, tracking device for the number that really counts: intrinsic business value.
He goes on to justify the “change in reporting”:
Today, our emphasis has shifted in a major way to owning and operating large businesses. Many of these are worth far more than their cost-based carrying value. But that amount is never revalued upward no matter how much the value of these companies has increased. Consequently, the gap between Berkshire’s intrinsic value and its book value has materially widened.
There is certainly some validity to the change in reporting metrics.
However, we must ask the question:
The old reporting format was good to go from 1965 to 2013…
Why change now?
Did it have anything to do with the worst book-value performance run in history for Berkshire Hathaway?
Odd.
Not saying, I’m just saying…
Reporting Differences Illuminated
In the old days there were 3 columns:
- Book value per share
- S&P 500 Total Return
- Difference between 1 and 2
See below…
Pre 2014 performance format:
In the newest report there are 3 columns:
- Book value per share (Berkshire)
- Market value per share (Berkshire)
- S&P 500 Total Return

About the Author: Wesley Gray, PhD
—
Important Disclosures
For informational and educational purposes only and should not be construed as specific investment, accounting, legal, or tax advice. Certain information is deemed to be reliable, but its accuracy and completeness cannot be guaranteed. Third party information may become outdated or otherwise superseded without notice. Neither the Securities and Exchange Commission (SEC) nor any other federal or state agency has approved, determined the accuracy, or confirmed the adequacy of this article.
The views and opinions expressed herein are those of the author and do not necessarily reflect the views of Alpha Architect, its affiliates or its employees. Our full disclosures are available here. Definitions of common statistics used in our analysis are available here (towards the bottom).
Join thousands of other readers and subscribe to our blog.