Rebalance frequency affects value and quality factors in different ways:
- Value works better when assessed more frequently
- Quality factors work about the same, regardless of frequently.
Other important findings:
- Value portfolios outperform the market, historically.
- Quality portfolios perform inline with the market, historically.
With a plethora of Quality-based ETFs and Value investing ETFs in the marketplace, we hope this research piece encourages investors to investigate the construction of the products they buy.
Our Simple Empirical Tests
First, let’s set up the experiment. We will examine all firms above the NYSE 40th percentile for market-cap (currently around $1.8 billion) on June 30th each year with the following 2 variables (akin to those used in the so-called “magic formula”):
- Quality = EBIT / (Net Working Capital and Net Fixed Assets)
- Value = EBIT/(Total Enterprise Value)
We sort securities on both variables, and select the top decile of firms. We examine 3 rebalance frequencies: 1-year, 3-years, and 5-years. The portfolios rebalanced every 3 or 5 years are formed by creating overlapping portfolios.
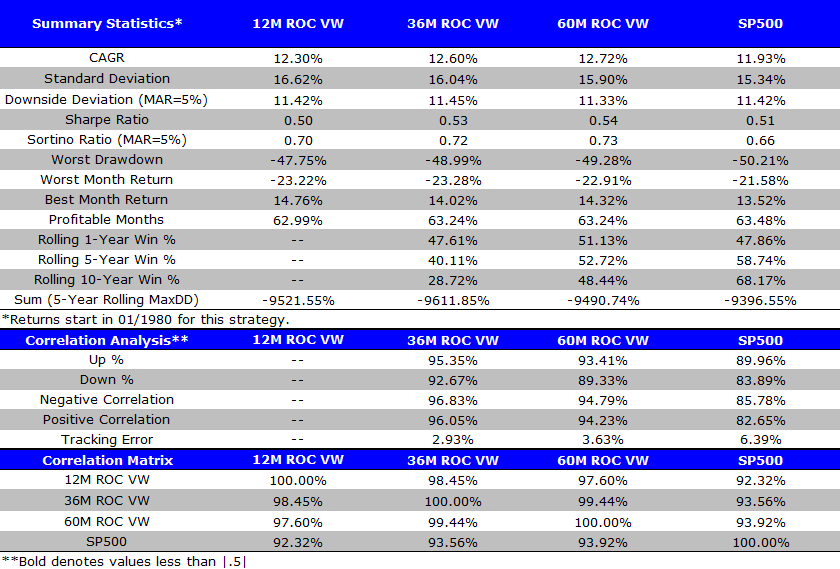
Quality Investing Performance
We examine 4 strategies:
- 12M ROC VW = Top decile of firms formed on Quality measure. Firms are held in the portfolio for 12 months. Portfolio is value-weighted.
- 36M ROC VW = Top decile of firms formed on Quality measure. Firms are held in the portfolio for 36 months. Portfolio is value-weighted.
- 60M ROC VW = Top decile of firms formed on Quality measure. Firms are held in the portfolio for 60 months. Portfolio is value-weighted.
- SP500 = S&P 500 Total return
Results are gross of management fees and transaction costs. All returns are total returns and include the reinvestment of distributions (e.g., dividends).
Here are the returns (1/1/1980-12/31/2013):
The results are hypothetical results and are NOT an indicator of future results and do NOT represent returns that any investor actually attained. Indexes are unmanaged, do not reflect management or trading fees, and one cannot invest directly in an index. Additional information regarding the construction of these results is available upon request.
Two takeaways from the results:
- Sorting firms on quality performs similarly to an index.
- As the holding period increases, performs metrics improve, but the effect is marginal.
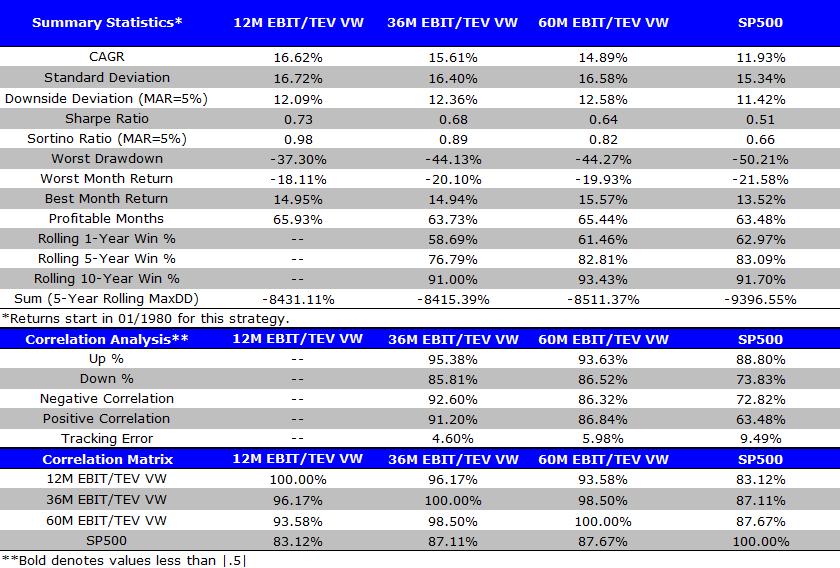
Value Investing Performance
Here we examine 4 strategies:
- 12M EBIT/TEV VW = Top decile of firms formed on Value measure. Firms are held in the portfolio for 12 months. Portfolio is value-weighted.
- 36M EBIT/TEV VW = Top decile of firms formed on Value measure. Firms are held in the portfolio for 36 months. Portfolio is value-weighted.
- 60M EBIT/TEV VW = Top decile of firms formed on Value measure. Firms are held in the portfolio for 60 months. Portfolio is value-weighted.
- SP500 = S&P 500 Total return
Results are gross of management fees and transaction costs. All returns are total returns and include the reinvestment of distributions (e.g., dividends).
Here are the returns (1/1/1980-12/31/2013):
The results are hypothetical results and are NOT an indicator of future results and do NOT represent returns that any investor actually attained. Indexes are unmanaged, do not reflect management or trading fees, and one cannot invest directly in an index. Additional information regarding the construction of these results is available upon request.
Two takeaways from the results:
- Sorting firms on a value measure (EBIT/TEV) adds value over the index. The spread (with a 12-month holding period) is 400 bps higher compared to sorting firms on quality.
- As the holding period increases, CAGR, Sharpe and Sortino ratios decrease. This has been documented elsewhere, as value measures appear to work better when assessed more frequently.
Summary
When discussing rebalance frequency we need to consider the trade-off between transaction costs (e.g., fees, taxes) and expected performance. We examine the returns gross of fees and leave it to the reader to determine if there is a net benefit between rebalance frequency and expected performance — everyone has their own opinion on “real transaction costs”. For value, it is arguable that one can rebalance more frequently and beat the costs; for quality, rebalance frequency doesn’t seem to matter, and after costs, it therefore wouldn’t seem to help.

About the Author: Jack Vogel, PhD
—
Important Disclosures
For informational and educational purposes only and should not be construed as specific investment, accounting, legal, or tax advice. Certain information is deemed to be reliable, but its accuracy and completeness cannot be guaranteed. Third party information may become outdated or otherwise superseded without notice. Neither the Securities and Exchange Commission (SEC) nor any other federal or state agency has approved, determined the accuracy, or confirmed the adequacy of this article.
The views and opinions expressed herein are those of the author and do not necessarily reflect the views of Alpha Architect, its affiliates or its employees. Our full disclosures are available here. Definitions of common statistics used in our analysis are available here (towards the bottom).
Join thousands of other readers and subscribe to our blog.