Investors should know what they are buying and why they are buying it.
Unfortunately, more often than not, investment products are jammed down the throats of unsuspecting victims who are either ignorant, easy to influence, and/or don’t really care.
We highlighted an extreme example of this in the form of a 3% front-end load, 60bp management fee S&P 500 Index Fund. Ben Carlson, our friend at http://awealthofcommonsense.com/, went one step further and found a 5% front-end load, 75bps version.
But how can we prevent investors from making bad decisions? Our answer is education.
As part of our goal to help investors make better decisions, we like to design simple frameworks. One example is a concept we developed many years ago that we call the “Sustainable Alpha Pyramid” (I talk about it in my co-authored book, Quantitative Value).
A visual outline of the framework is outlined below.
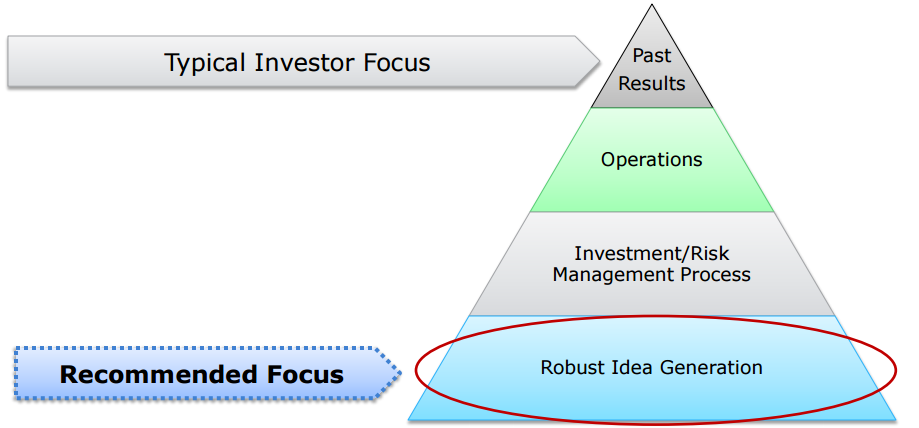
The Sustainable Alpha Pyramid identifies what matters for identifying future expected performance and ranks these elements according to their relative importance. The most fundamental requirement for sustainable alpha is at the base, and the least important requirement at the peak. I outline each element briefly:
-
-
- Robust Idea Generation: A manager must have a sustainable “edge,” or ability to beat the market over the long-term. Why does the strategy work? Who is on the losing side of the trades and why will the loser keep losing? Active management is essentially a zero-sum game. Without a true edge, the only way that future expected returns can beat the market is via luck.
-
- Risk Management: To take advantage of any edge created by robust idea generation, a manager must have a sensible risk management process. Is it reasonable to invest all of the capital (and use leverage) in a single best idea? Is the manager saying, “The stock was great at $10, even better at $5, and we’re all-in at $1.” If extreme concentration is foolish, how much diversification is enough? We want to avoid too much diversification, or diworsification. A poorly designed risk management process can turn a robust idea generation process into a robust nightmare.
-
- Operations: As the 27th Commandant of the Marine Corps Gen. Robert Borrow once said, “Amateurs talk about tactics, but professionals study logistics.” The best ideas and risk management processes are worthless if the investment manager can’t operate. Are communications clear between portfolio managers and the traders? Or is the portfolio manager asking to sell a stock, while the trading desk is buying the stock? Do the internal processes and workflows reflect the investment strategy? We need to ensure the strategy is executed as planned if we hope to succeed.
- Past Results: Reviewing past results is akin to walking through a minefield. There is definitely a “safe” route, but there are also a lot of hazards. We can get a clearer picture of the safe route after we have considered all of the previous stages and understand the context through which past results were earned. Nevertheless, throughout our analysis of past results we must understand that asset prices are extremely volatile, which means separating luck from skill will always pose a challenge.
Past Performance Doesn’t Predict Future Performance (unless you are REALLY bad)
Here is the original abstract (oddly enough, the paper is based on Carhart’s dissertation when he was a PhD at Chicago):
“Using a sample free of survivor bias, I demonstrate that common factors in stock returns and investment expenses almost completely explain persistence in equity mutual funds’ mean and risk-adjusted returns. Hendricks, Patel and Zeckhauser’s (1993) “hot hands” result is mostly driven by the one-year momentum effect of Jegadeesh and Titman (1993), but individual funds do not earn higher returns from following the momentum strategy in stocks. The only significant persistence not explained is concentrated in strong underperformance by the worst-return mutual funds. The results do not support the existence of skilled or informed mutual fund portfolio managers.”
Fast forward almost 20 years and this same conclusion is being described in the new Swedroe and Berkin book, “The Incredible Shrinking Alpha.” Michael Kitces provides a wonderful outline of the arguments and provides some interesting thoughts on investment “factors” and the marketplace:
“As research continues to identify unique risk factors that are rewarded with excess returns, what was once believed to be alpha is increasingly turning out to be an active manager who simply invested to benefit from a not-yet-identified-as-such risk factor.”
Essentially, we’re saying what Carhart said back in 1997 via his PhD dissertation. Most professional managers are not generating value after adjusting for some simple asset pricing factors.
But what are these so-called “factors?”
Factors are everywhere.
Some of the more famous factors are Value, Momentum, Size, and Market factors. In what follows, we provide some basic insight on some of the more popular factor models and we provide a tool so an enterprising investor can conduct basic factor analysis on their favorite managers.
Let’s first take a look at some famous factor models:
1. Fama French 3 factor
The simplest and most widely used asset pricing model is the “Fama French 3 factor model.” This model was first introduced by Nobel-Prize winner Eugene Fama and his long-time colleague, Ken French. The professors find that the three risk factors can explain a lot of the variation in stock returns–exposures to size, value, and market risk. Information on the factors is below:- Factors: Rm-Rf, SMB and HML, with details on construction here
- Source Academic Research: Fama and French (1992) and Fama and French (1993)
- Factor Data resource: Kenneth French Data Library
2. Fama French 3 Factor Model plus Carhart’s “Momentum factor”
Over the past 20 years, academic researchers found that the FF 3 factor model wasn’t explaining all market phenomenon. For example, the 3-factor model failed to explain why stocks with strong performance over the past 12 months continued to have strong performance, even after controlling for exposures to size, value, and market. So to solve this problem, a 4-factor model was born.- Factors: Rm-Rf, SMB, HML and MOM, with details on construction here
- Academic resource: Jegadeesh and Titman (1993)
- Factor Data resource: Kenneth French Data Library
-
3. QMJ 4 Factor Model
Frazzini and Pedersen (2013) shows that high-quality stocks outperformed low-quality stocks, historically. Generally, high quality stocks are ones that are “safe, profitable, growing and well managed.” They created a new factor, QMJ (Quality Minus Junk) to capture anomalies that cannot be explained by existing pricing models such as the 3-factor or 4-factor model. A recent paper by Frazzini and Pedersen points out that even the great value investor Warren Buffett can be explained by a simple factor model that controls for value, quality, and beta factors. Scary.
- New Factor: QMJ, with details on construction here
- Academic resource: Frazzini and Pedersen (2013)
- Factor Data resource: Professor Frazzini Data Center
4. Hedge Fund risk factor Model
Fung and Hsieh (2004) design a seven-factor model that specifically helps to measure the unique exposures created by hedge funds. The authors identify seven factors: 2 equity-oriented risk factors, 3 trend-following risk factors, and 2 interest rate-related risk factors.
- New Factor: 7 Hedge Fund Factors
- Academic resource: Fung and Hsieh (2004)
- Factor Data resource: David Hsieh’s Data Library
5.Fama French’s New 5 Factor Model
The research of Novy-Marx highlights the “profitability factor” and suggests that profitable firms generate significantly higher average future returns since they tend to generate more robust cashflows and are less prone to distress. In 2014, Fama and French include the profitability factor into a new factor model. What’s more, they consider an “investment factor“, which represents the expected growth of book equity. We are now left with a bit of a “factor zoo” in the form of a 5-factor model that controls for a variety of stock characteristics.
- Factors: Rm-Rf, SMB, HML, RMW (Robust Minus Weak, profitability factor) and CMA (Conservative Minus Aggressive, Investment Patterns factor)
- Academic resource: Fama and French (2014)
- Factor Data resource: Kenneth French Data Library
How to do We Conduct Basic Factor Analysis?
We are building robust online tools to conduct advanced factor analysis, but we won’t have this completely finished for a few more weeks.
In the meantime, we built a simple excel tool to help you conduct factor analysis. Here is a tutorial we did from 3 years ago and here are some more in-depth thoughts from a few years ago:
- Focus on what you can get for free (part 1/2)
- Focus on what you can get for free (part 2/2)
- Is Smart Beta Bullshit?
Let’s work through an example factor analysis. Each month, the street.com published a list of top 20 value-stock mutual funds. We chose the No.1 ranked as of 4/30/2015, Fidelity Value Discovery Fund (Ticker: FVDFX) as our example, and then conducted a basic factor analysis.
Here’s how we did the analysis:
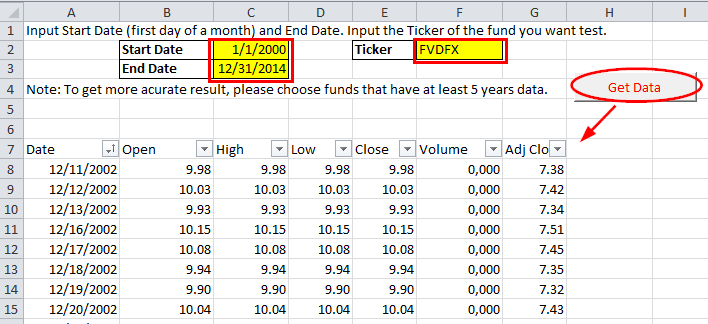
Step 1:
- Input start date (first day of a month, as limited by 7/1/1963) and end date (as limited by 12/31/2014).
- Here we insert 1/1/2000 as start date and 12/31/2014 as end date.
- Then input the ticker of the fund you want to test.
- We choose “FVDFX” as our test sample. (Please note that the inception date of BPAIX is 12/11/2002, so the data starts at this date instead of our input date).
Step 2: Assess the results. Note: Please enable macros when opening the file.
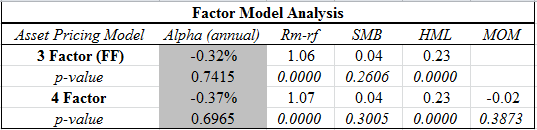
Factor Model Result
The factor table is populated automatically. Below are the definitions for the outputs:
Rm-Rf (Market return minus Risk Free rate): the exposure to the excess return between the market and the risk-free rate (classic market “beta”).
SMB (Small firms minus big firms): we can see the exposure of the strategy to smaller versus larger firms.
HML (High book to market minus low book to market, e.g., Value minus Growth): we can see the exposure of the strategy to value versus growth.
MOM (High Momentum minus low momentum): we can see the exposure of the strategy to high momentum versus low momentum firms.
Key takeways from our sample example:
- The 3 factor “alpha” is about -0.32 % per year, and the 4 factor “alpha” is about -0.37% per year. So there’s no value added.
- The coefficients of HML is about 0.23 for both 3 factor and 4 factor model, which means this fund is a pseudo value fund.
- The coefficients of Mkt-Rf is around 1.06. This fund is highly correlated with the market.
In the example above, we examined a mainstream mutual fund and discovered, through factor analysis, that it was not doing anything special, but rather was simply providing basic factor exposures. How many more mutual funds out there are like this? Probably plenty. We leave it to the enterprising investors to use our tools to explore the landscape and separate the wheat from chaff. Don’t get caught paying for an overpriced mutual fund that can be replicated at much lower cost.
————————————
Here is a copy of the excel tool:
Factor Model Tool
————————————
About the Author: Wesley Gray, PhD
—
Important Disclosures
For informational and educational purposes only and should not be construed as specific investment, accounting, legal, or tax advice. Certain information is deemed to be reliable, but its accuracy and completeness cannot be guaranteed. Third party information may become outdated or otherwise superseded without notice. Neither the Securities and Exchange Commission (SEC) nor any other federal or state agency has approved, determined the accuracy, or confirmed the adequacy of this article.
The views and opinions expressed herein are those of the author and do not necessarily reflect the views of Alpha Architect, its affiliates or its employees. Our full disclosures are available here. Definitions of common statistics used in our analysis are available here (towards the bottom).
Join thousands of other readers and subscribe to our blog.