How risky is it to buy an individual stock?
This is a question investors should ask themselves when deciding to buy a single stock. However, many investors tend to get caught up in the story about why company XYZ is going to double over the next year.
As an educated investor, it makes sense to know the odds table. What we hope to do here is present a distribution of the total returns one would have earned by owning an individual stock.
The Tests:
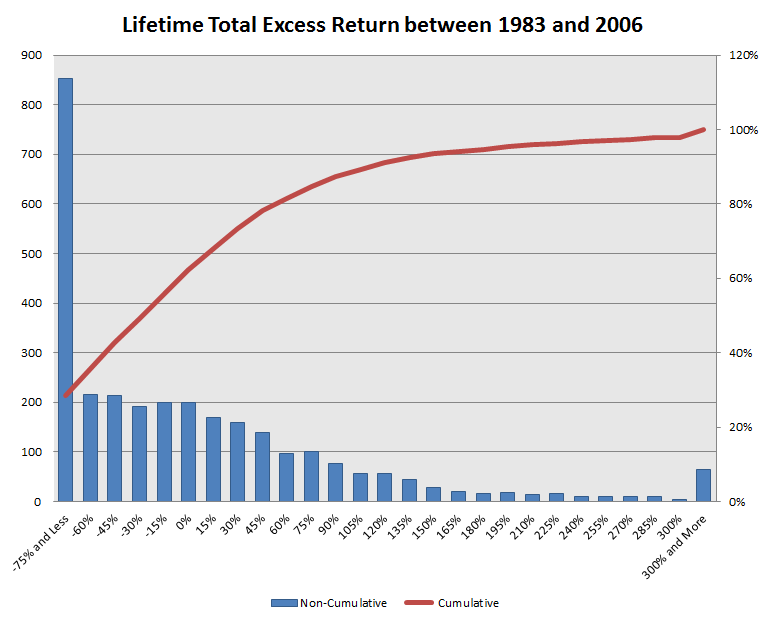
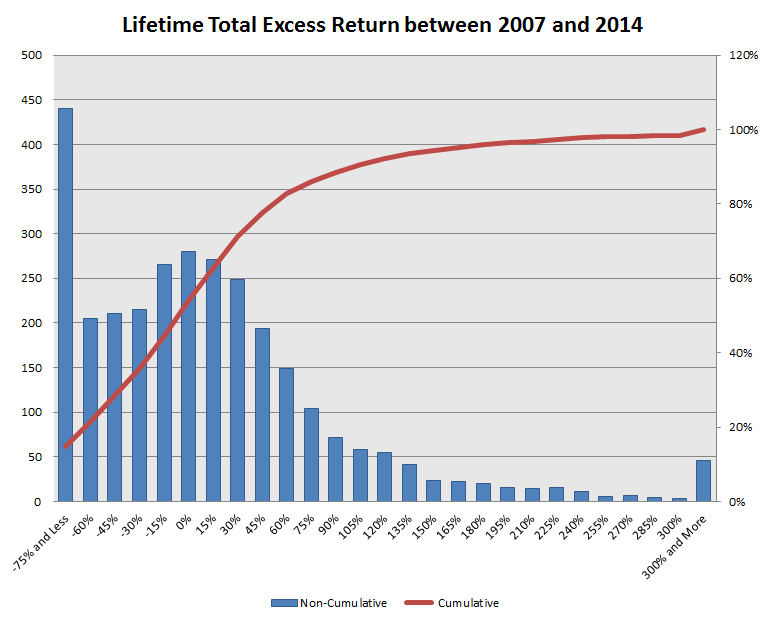
The distribution is generated over two time periods. The first period is 1/1/1983 – 12/31/2006 and the second period is 1/1/2007 – 12/31/2014. The universe is created on 12/31/1982 (and 12/31/2006) by selecting the top 3000 stocks ranked by market capitalization. The initial universe is then compared to owning the Russell 3000 index. We examine the excess returns an investor would have earned by owning one stock compared to the universe.
The excess return is computed monthly by taking the stock’s total return and subtracting off the index return. So if stock XYZ earned 10% in January, while the Russell 3000 index earned 4%, the “excess return” for the month would be 10% – 4% = 6%. For each stock, we then compute the cumulative excess return over time, by compounding the monthly excess returns.
The results are shown below:
First Period: 1/1/1983 to 12/31/2006

The results are hypothetical results and are NOT an indicator of future results and do NOT represent returns that any investor actually attained. Indexes are unmanaged, do not reflect management or trading fees, and one cannot invest directly in an index. Additional information regarding the construction of these results is available upon request.
Takeaways:
- Around 63% of individual stocks underperform! This means that only 37% of individual stocks outperform the benchmark!
- The probability of beating the benchmark by more than 100% is only 11%!
Second Period: 1/1/2007 to 12/31/2014

The results are hypothetical results and are NOT an indicator of future results and do NOT represent returns that any investor actually attained. Indexes are unmanaged, do not reflect management or trading fees, and one cannot invest directly in an index. Additional information regarding the construction of these results is available upon request.
Takeaways:
- Around 54% of individual stocks underperform! This means that only 46% of individual stocks outperform the benchmark!
- The probability of beating the benchmark by more than 100% is only 10%!
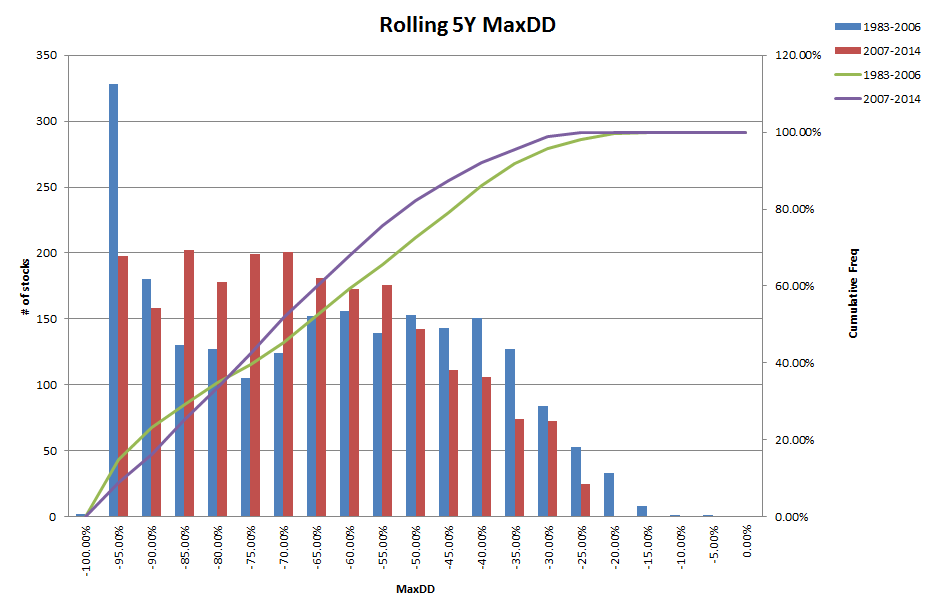
So while it appears that the more recent time period was better for stock pickers, the odds were still against buying an individual stock. An additional concern when buying one stock is that the investor takes on a lot of idiosyncratic risk. This can lead to larger drawdowns if there is bad news about your one stock portfolio. Here we examine the (gross) drawdowns of individual stocks.
Lifetime Rolling 5-Year Maximum Drawdowns:
To be included in the analysis, we require stocks to have at least 5 years of performance data.

The results are hypothetical results and are NOT an indicator of future results and do NOT represent returns that any investor actually attained. Indexes are unmanaged, do not reflect management or trading fees, and one cannot invest directly in an index. Additional information regarding the construction of these results is available upon request.
Takeaways:
- Between 1983 and 2006, around 73% of firms had a drawdown of larger than 50% (the SP500’s MaxDD during this period is around 44%). From 2007 – 2014, this number is 82% (the SP500’s MaxDD during this period is around 50%). Holding one individual stock can be very risky!
Conclusion
Buying an individual stock can be risky, and beating the market is difficult. Individual stock picking can also lead to large drawdowns, which are hazardous to one’s wealth. Hopefully, armed with our odds table above, we all form nice diversified portfolios!
About the Author: Wesley Gray, PhD
—
Important Disclosures
For informational and educational purposes only and should not be construed as specific investment, accounting, legal, or tax advice. Certain information is deemed to be reliable, but its accuracy and completeness cannot be guaranteed. Third party information may become outdated or otherwise superseded without notice. Neither the Securities and Exchange Commission (SEC) nor any other federal or state agency has approved, determined the accuracy, or confirmed the adequacy of this article.
The views and opinions expressed herein are those of the author and do not necessarily reflect the views of Alpha Architect, its affiliates or its employees. Our full disclosures are available here. Definitions of common statistics used in our analysis are available here (towards the bottom).
Join thousands of other readers and subscribe to our blog.

