Investing in the current environment is difficult. Most, if not all, asset classes have high nominal prices, suggesting low nominal expected returns. Not exactly exciting. And for many investors who are retired and/or have near-term liquidity needs, investing in equity exposures–while necessary to generate higher expected returns–also prevents many investors from sleeping at night!
One solution to curb the risk of a massive market meltdown is to buy portfolio insurance. However, in a rational world, insurance contracts are expensive because they protect us when we need protection the most. Insurance has this pesky problem of charging a large premium for downside protection. For example, consider put options on the S&P 500 market index. If an investor wants to hedge against a 10% drawdown for a year, the cost (as of August 13, 2015) would be approximately 4% of the notional value to be hedged. So if you had a $1,000,000 stock portfolio and wanted to ensure the most you could lose was $100,000, the cost of that insurance for one year would be around $40,000.
Clearly, buying portfolio insurance can be expensive.
But what if we could identify unique assets where the cost of insurance was much lower?
We’ve identified 3 candidates that may fit this profile (in no particular order):
- US Treasury Bonds
- Hedge Fund Factors
- Managed Futures
We highlight some of the historical evidence of the abilities of these assets to provide portfolio insurance (they go way up, when stock markets go way down).
Of course, past performance is no guarantee of future performance, and nobody can know what will happen in the future, but the results inspired us to dig a little deeper and think harder about our own portfolio construction efforts.
1. US Treasury Bonds
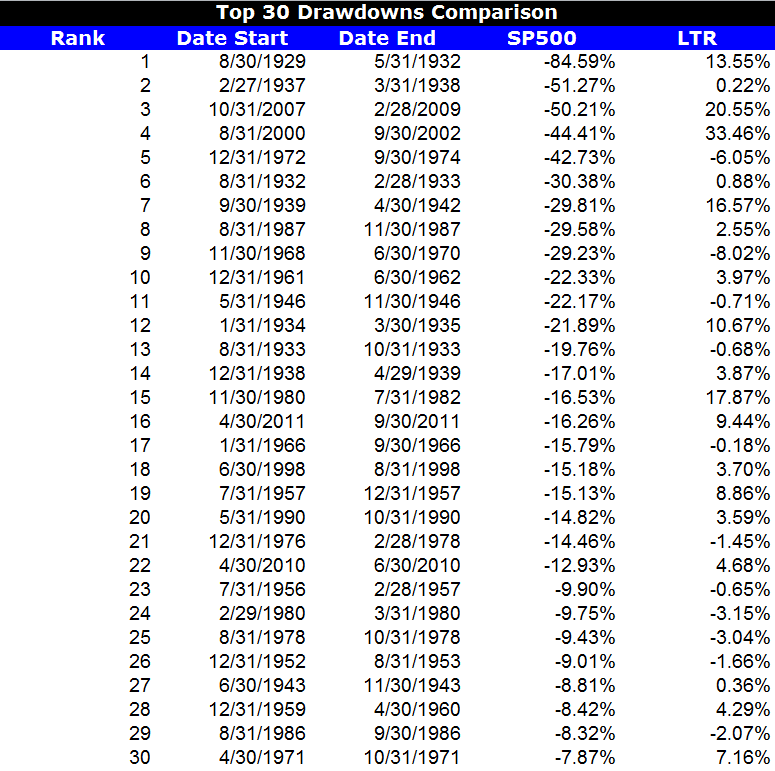
The results below highlight the top 30 drawdowns in the S&P 500 Total Return Index from 1927 to 2013. Results are gross of management fees and transaction costs. All returns are total returns and include the reinvestment of distributions (e.g., dividends).
Next to the S&P 500 return is the corresponding total return on the 10-Year (LTR) over the same drawdown period.
Bottomline: When the market blows up, flight-to-quality 10-Years have done well.
Caveat(s): A low yield environment may limit the upside potential of the insurance benefit; flight-to-quality status required.

The results are hypothetical results and are NOT an indicator of future results and do NOT represent returns that any investor actually attained. Indexes are unmanaged, do not reflect management or trading fees, and one cannot invest directly in an index. Additional information regarding the construction of these results is available upon request.
2. Hedge Fund Factors
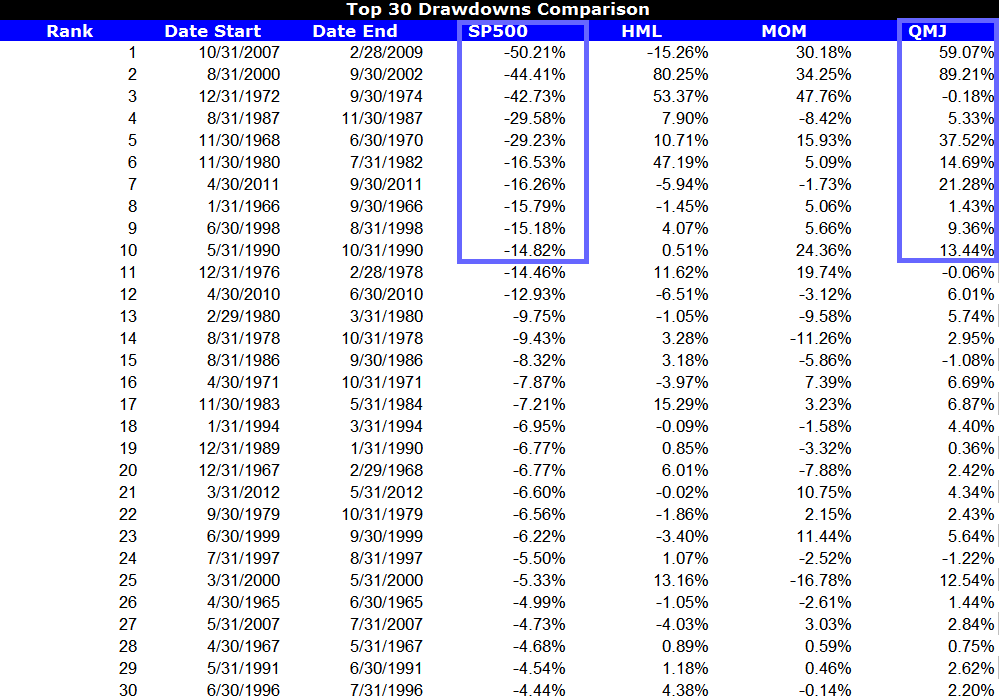
We examine 3 common hedge fund “factor” portfolios alongside the S&P 500 Index:
- SP 500 = SP 500 Total Return Index
- HML = The average of 2 value portfolios (small and large) minus the average return of two growth portfolios (again, small and large)
- MOM = The average of 2 high return portfolios (small and large) minus the average return of two low return portfolios (small and large)
- QMJ = The average of 2 high-quality portfolios (small and large) minus the average return of two low-quality portfolios (small and large)
Results are gross of management fees and transaction costs. All returns are total returns and include the reinvestment of distributions (e.g., dividends).
Data are from AQR and Ken French.
Next to the S&P 500 return is the corresponding total return on hedge fund factors over the same drawdown period.
Bottomline: When the market blows up, hedge fund factors have done well.
Caveat(s): Transaction costs on the short-book can be extraordinary; carry costs during raging markets can be unbearable.

The results are hypothetical results and are NOT an indicator of future results and do NOT represent returns that any investor actually attained. Indexes are unmanaged, do not reflect management or trading fees, and one cannot invest directly in an index. Additional information regarding the construction of these results is available upon request.
3. Managed Futures
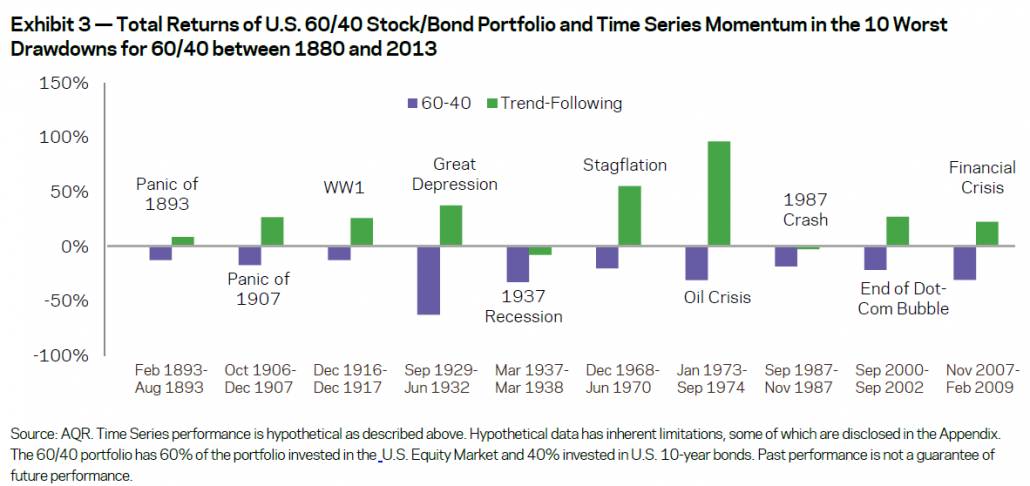
Here we examine a chart from a white paper by the folks at AQR. The paper is called, “A Century of Evidence on Trend-Following Investing.” The trend-following concept analyzed can be considered a generic managed futures strategy.
Bottomline: When the market blows up, trend-following managed futures have done well.
Caveat(s): Won’t protect an investor in a “flash crash” event; need historical correlations during bad markets to continue.

The results are hypothetical results and are NOT an indicator of future results and do NOT represent returns that any investor actually attained. Indexes are unmanaged, do not reflect management or trading fees, and one cannot invest directly in an index. Additional information regarding the construction of these results is available upon request.
Conclusion
Historically, Treasury Bonds, Hedge Fund Factors, and Managed Futures have all managed to act like portfolio insurance, even though they aren’t traditionally considered insurance assets. Will this pattern continue in the future? Who knows…and of course, that is the million dollar question…
Let us know if you’ve seen other hidden portfolio insurance options out there. Please share ideas…
About the Author: Wesley Gray, PhD
—
Important Disclosures
For informational and educational purposes only and should not be construed as specific investment, accounting, legal, or tax advice. Certain information is deemed to be reliable, but its accuracy and completeness cannot be guaranteed. Third party information may become outdated or otherwise superseded without notice. Neither the Securities and Exchange Commission (SEC) nor any other federal or state agency has approved, determined the accuracy, or confirmed the adequacy of this article.
The views and opinions expressed herein are those of the author and do not necessarily reflect the views of Alpha Architect, its affiliates or its employees. Our full disclosures are available here. Definitions of common statistics used in our analysis are available here (towards the bottom).
Join thousands of other readers and subscribe to our blog.

