A few months ago we highlighted a surprising result: cheap high-quality stocks were getting crushed by expensive junk stocks.
The spread at the end of June was around 18%. Here is the chart from the old post (details on construction are in the original post):

The results are hypothetical results and are NOT an indicator of future results and do NOT represent returns that any investor actually attained. Indexes are unmanaged, do not reflect management or trading fees, and one cannot invest directly in an index. Additional information regarding the construction of these results is available upon request.
Logical conclusion: Buy Value!
Fast forward 2 months…
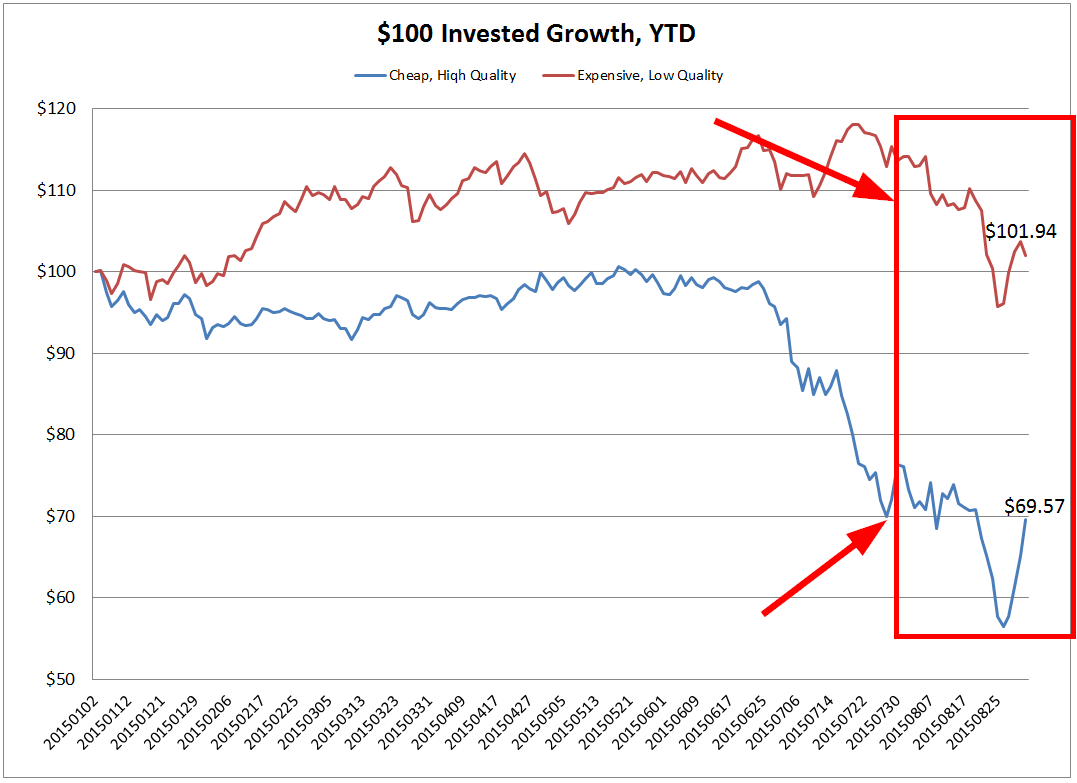
Here we look at the updated YTD performance comparing expensive junk stocks to cheap high quality stocks.
We examine value-weight returns for the cheap high-quality quintile and the expensive low-quality quintile. The daily returns run from 1/1/2015 to 8/31/2015. Results are gross of fees. All returns are total returns and include the reinvestment of distributions (e.g., dividends).
Specifically, here are the two portfolios:
- Cheap, High Quality = Value-weight returns to the cheap high-quality quintile.
- Expensive, Low Quality = Value-weight returns to the expensive low-quality quintile.
The results are hypothetical results and are NOT an indicator of future results and do NOT represent returns that any investor actually attained. Indexes are unmanaged, do not reflect management or trading fees, and one cannot invest directly in an index. Additional information regarding the construction of these results is available upon request.
An 18% spread was bad enough–how about we double down on that? The generic cheap quality versus expensive junk spread is over 30% YTD. Just when we thought things couldn’t get any worse – they got a whole lot worse! The results are driven by a horrific July, that looks anomalous, but still…Wow!
Logical conclusion: Buy value?! …hmmm…maybe it’s time to get rid of those value stocks and try something else? It’s not working now so maybe value doesn’t work any more?
But be careful with “logical” conclusions. As we’ve said time and time again, active value investing has been digging manager graveyards since 1900…but that is the nature of the active value investing game…long horizons are required and volatility relative to the standard benchmarks can be expected.
These are the times that try men’s souls.
– Thomas Paine

About the Author: Wesley Gray, PhD
—
Important Disclosures
For informational and educational purposes only and should not be construed as specific investment, accounting, legal, or tax advice. Certain information is deemed to be reliable, but its accuracy and completeness cannot be guaranteed. Third party information may become outdated or otherwise superseded without notice. Neither the Securities and Exchange Commission (SEC) nor any other federal or state agency has approved, determined the accuracy, or confirmed the adequacy of this article.
The views and opinions expressed herein are those of the author and do not necessarily reflect the views of Alpha Architect, its affiliates or its employees. Our full disclosures are available here. Definitions of common statistics used in our analysis are available here (towards the bottom).
Join thousands of other readers and subscribe to our blog.