In the past we have discussed how to combine value and momentum investing strategies to improve an equity allocation.
In this piece we discuss why an investor should combine value and momentum investing concepts.*
Many investors recognize that stand-alone value and momentum investment strategies have historically worked. Of course, these strategies don’t work all the time and can have long streaks of terrible performance. But long-only value and momentum investing, while interesting, don’t represent the most puzzling anomaly from financial research. The biggest puzzle is that long/short value and momentum have a negative correlation. In other words, long/short value and momentum portfolios tend to work at different times. An implication is that a long-term equity investor can manage a portfolio allocated to long-only value and momentum strategies and capture the benefits of these anomalies, but also eliminate a lot of the idiosyncratic risk associated with following either of these strategies in isolation.
Cliff Asness has a wonderful paper that highlights the need for investors to consider the portfolio benefits of a strategy, in addition to a strategy’s stand-alone investment merits. The paper is titled, “Momentum in Japan: The Exception That Proves the Rule.”
The paper examines the data from Japanese equities, which some researchers interpret as suggesting that momentum investing doesn’t work. For example, Eugene Fama recently mentioned that the Japanese data suggest that momentum might be an artifact of data-mining.
Asness takes on the challenge from a different angle. First, he highlights that long/short momentum didn’t do well from 1981-2010. A table from the paper:
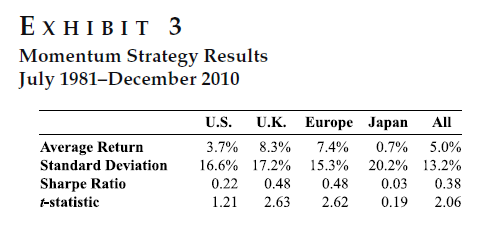
The results are hypothetical results and are NOT an indicator of future results and do NOT represent returns that any investor actually attained. Indexes are unmanaged, do not reflect management or trading fees, and one cannot invest directly in an index. Additional information regarding the construction of these results is available upon request.
Cleary, long/short momentum wasn’t a great stand alone strategy. But modern portfolio theory highlights that the assessment of an investment strategy should not be done in isolation, but in the context of a broader portfolio (e.g., insurance isn’t bad because it has a negative expectation). Asness brings this point forward. He shows that in Japan long/short momentum has a strong negative correlation with long/short value portfolio. The reader can visualize this in the chart below:
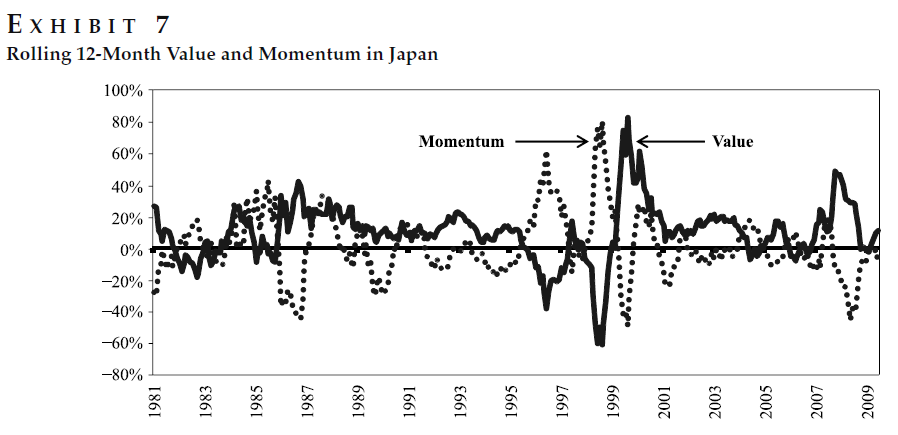
The results are hypothetical results and are NOT an indicator of future results and do NOT represent returns that any investor actually attained. Indexes are unmanaged, do not reflect management or trading fees, and one cannot invest directly in an index. Additional information regarding the construction of these results is available upon request.
On average, when one strategy zigs, the other zags. So from a diversification and risk-management perspective, momentum still “works.”
Of course, the research above talks about long/short portfolios and the analysis and takeaway is complex for those who aren’t card-carrying finance geeks. We’re going to simplify the situation. We will make the same point using long-only portfolios and have no requirement that the reader be a finance geek.
Let’s ask a basic question: what happens when one examine long-only value and momentum investment portfolios?
So others can replicate our results, we examine data from Ken French’s website. Specifically, we examine the returns to the value-weight portfolio formed on Value (B/M) and the value-weight portfolio formed on Intermediate-Term Momentum for United States stocks.
First, we examine the returns from 1927-2015 for 4 portfolios:
- Value: Top Decile of firms ranked on B/M from Ken French’s website. We use the value-weight portfolio returns.
- Momentum: Top Decile of firms ranked on Intermediate-Term momentum (past 12 months excluding last month) from Ken French’s website. We use the value-weight portfolio returns.
- SP500: The total return to the S&P 500.
- RF: Total return to the risk-free rate (taken from Ken French’s website).
Results are gross of transaction costs and management fees. All returns are total returns and include the reinvestment of distributions (e.g., dividends).
1/1/1927 – 12/31/2015
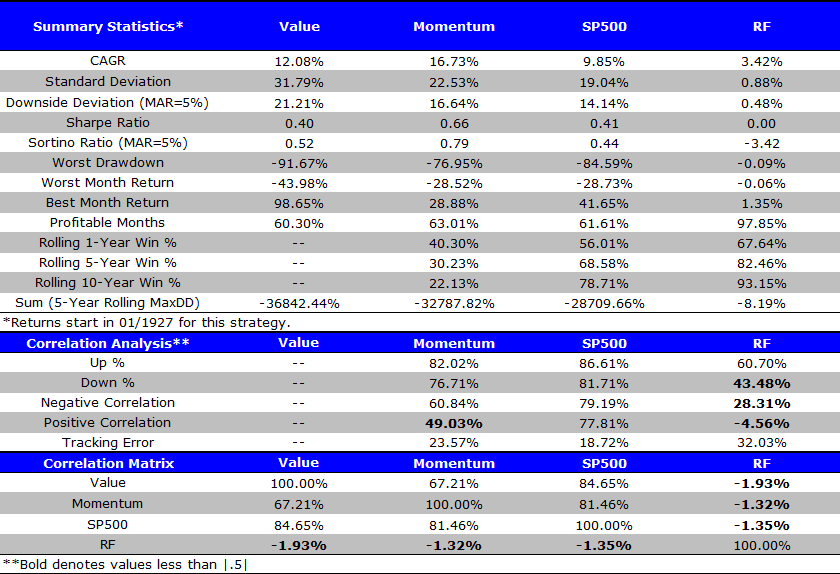
The results are hypothetical results and are NOT an indicator of future results and do NOT represent returns that any investor actually attained. Indexes are unmanaged, do not reflect management or trading fees, and one cannot invest directly in an index. Additional information regarding the construction of these results is available upon request.
First, one notices the outperformance over the past 88 year of value and momentum compared to the market (before fees). One sees that the long-only value and momentum portfolios are not negatively correlated (as both have market exposure), while long/short value and momentum portfolios are negatively correlated (as they have minimal market exposure due to being a long/short portfolio).
However, an important finding is that value and momentum have a lower correlation (67.21%) compared to value and the SP500 (84.65%) as well as momentum and the SP500 (81.46%).
Given that these portfolios have lower correlations, we examine what happens when one invests 50% of a portfolio in Value and 50% in Momentum each month (assume a monthly rebalance back to 50%/50%).
We examine the returns from 1927-2015 for 4 portfolios:
- 50% Value, 50% Momentum: A strategy that invests 50% in the Value portfolio and 50% in the Momentum portfolio described below. We assume the investor rebalances the portfolio to 50%/50% every month.
- Value: Top Decile of firms ranked on B/M from Ken French’s website. We use the value-weight portfolio returns.
- Momentum: Top Decile of firms ranked on Intermediate-Term momentum (past 12 months excluding last month) from Ken French’s website. We use the value-weight portfolio returns.
- SP500: The total return to the S&P 500.
Results are gross of transaction costs and management fees. All returns are total returns and include the reinvestment of distributions (e.g., dividends).
1/1/1927 – 12/31/2015
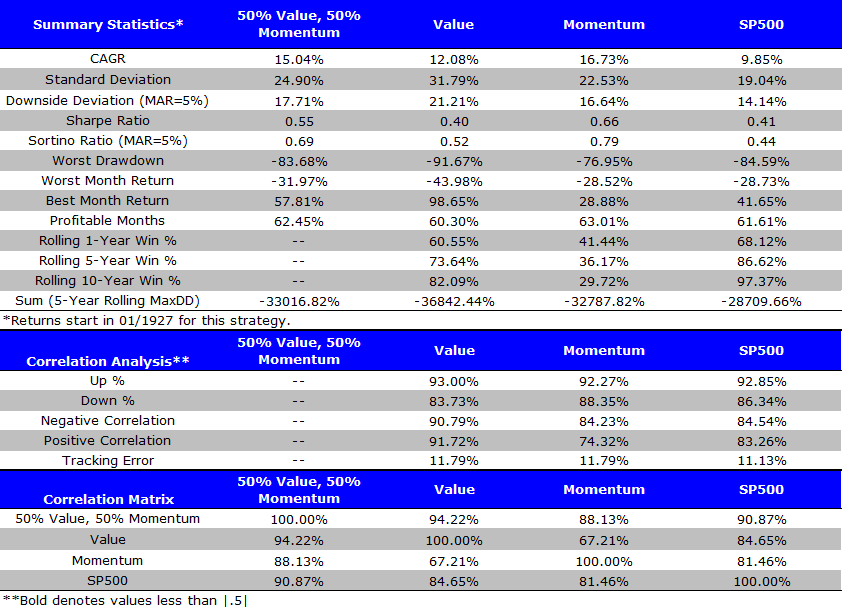
The results are hypothetical results and are NOT an indicator of future results and do NOT represent returns that any investor actually attained. Indexes are unmanaged, do not reflect management or trading fees, and one cannot invest directly in an index. Additional information regarding the construction of these results is available upon request.
As expected, the overall 50%/50% performs well, as an investor in value and momentum strategies receives some free diversification benefits of investing in both factors. The combination portfolio is nice because sometimes Value works, while other times Momentum works. We try to show this visually through two graphs below.
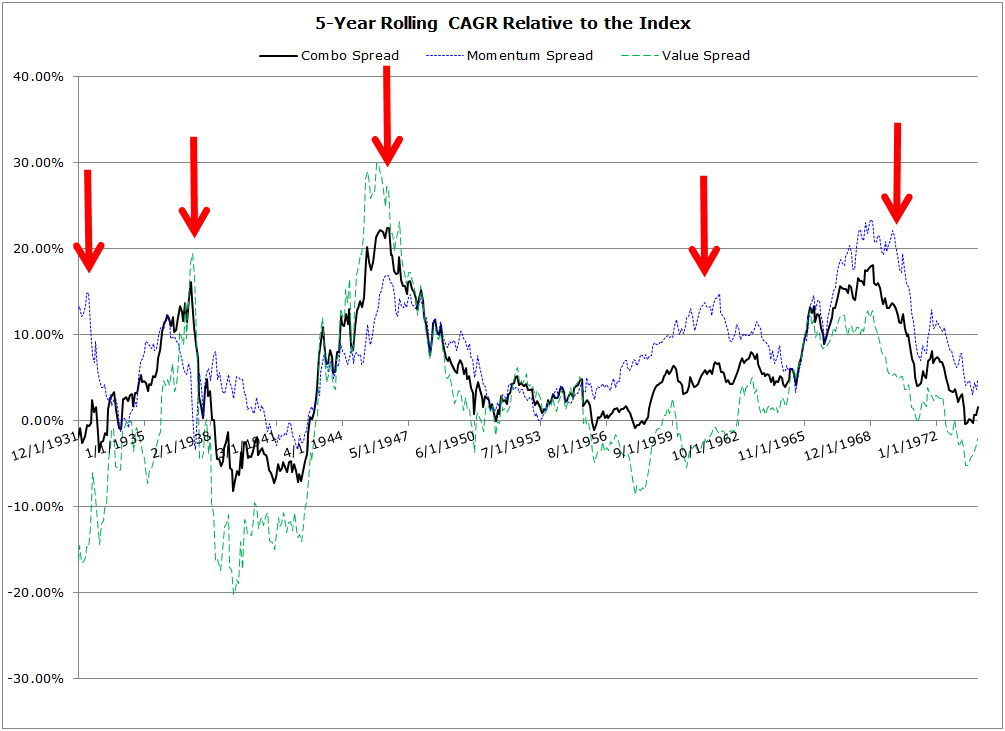
To assess the ability of combination value and momentum portfolios to smooth the path to long-term performance, we examine the spread between 5-year compound annual growth rates for a specific strategy relative to the passive benchmark (S&P 500).
First Half (1/1/1927 – 12/31/1973)
The results are hypothetical results and are NOT an indicator of future results and do NOT represent returns that any investor actually attained. Indexes are unmanaged, do not reflect management or trading fees, and one cannot invest directly in an index. Additional information regarding the construction of these results is available upon request.
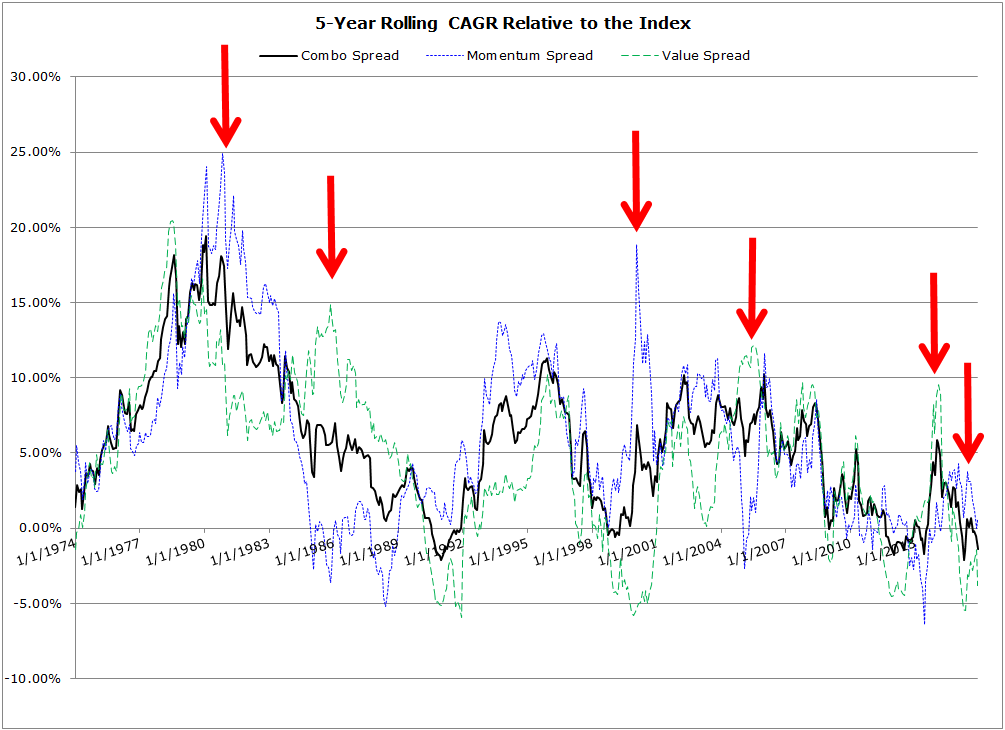
Second Half (1/1/1974 – 12/31/2015)
The results are hypothetical results and are NOT an indicator of future results and do NOT represent returns that any investor actually attained. Indexes are unmanaged, do not reflect management or trading fees, and one cannot invest directly in an index. Additional information regarding the construction of these results is available upon request.
The evidence suggests that a value and momentum investing system, which combines both pure value and pure momentum into a single portfolio, may prevent a value-only investor or a momentum-only investor from suffering through extended, long-term stretches of poor performance. Of course, not all pain can be erased, and investors must always be aware that they should expect to endure sustained stretches of volatility and relative underperformance, even with a globally diversified value and momentum equity portfolio. Nothing in life is easy, especially when it comes to investing!
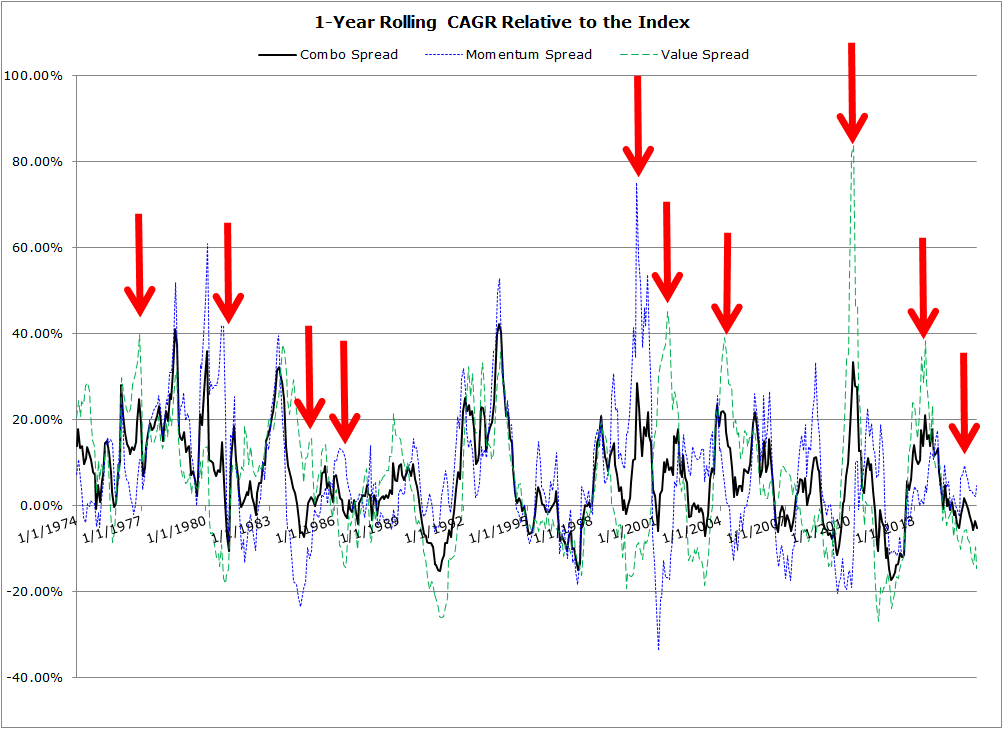
Another way to view the volatility from year to year for value and momentum investing is to examine the spread between 1-year compound annual growth rates for a specific strategy relative to the passive benchmark (S&P 500). The chart below (from the 2nd half) shows that from year to year, long-only value and momentum can quickly flip from being a big winner to a big loser, however the combination portfolio (on average) is a bit more stable year to year.
Second Half (1/1/1974 – 12/31/2015)
The results are hypothetical results and are NOT an indicator of future results and do NOT represent returns that any investor actually attained. Indexes are unmanaged, do not reflect management or trading fees, and one cannot invest directly in an index. Additional information regarding the construction of these results is available upon request.
As many remember, momentum did well in the internet bubble, and poorly thereafter. Similarly, Value did well in 2014, but got crushed in 2015. Bottomline: combining value and momentum helps manage long stretches of underperformance.
Despite the clear benefits of maintaining roughly static exposures to both value and momentum, readers always ask us if there is a way to “time” the factors. We think this is a risky proposition at the outset, because we give up a “bird in the hand” in the form of a well-established diversification benefit, to take on a “potential bird in the bush” benefit of capturing some extra returns by timing across value and momentum. We present the data below on the most common concept people ask us to test.
A simple idea is the following — keep a track of the total return to Value and Momentum over the past 12 months, and whichever factor has done better, allocate more to that factor. In other words, we can deploy a basic relative-strength rule across the two portfolios.
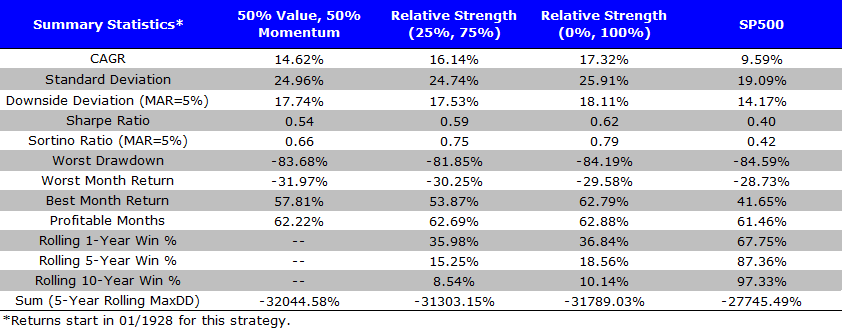
To test this idea, we examine the returns from 1928-2015 for 4 portfolios (Note we lose 1927 as we need to compute the 12-month return during this year):
- 50% Value, 50% Momentum: A strategy that invests 50% in the Value portfolio and 50% in the Momentum portfolio described above. We assume the investor rebalances the portfolio to 50%/50% every month.
- Relative Strength (25%, 75%): Based on the past 12 months total return to Value and Momentum, every month this portfolio invests 75% in the strategy (Value or Momentum) with the higher past 12 months return, and 25% in the strategy (Value or Momentum) with the lower past 12 months return. We assume the investor rebalances the portfolio every month.
- Relative Strength (0%, 100%): Based on the past 12 months total return to Value and Momentum, every month this portfolio invests 100% in the strategy (Value or Momentum) with the higher past 12 months return, and 0% in the strategy (Value or Momentum) with the lower past 12 months return. We assume the investor rebalances the portfolio every month.
- SP500: The total return to the S&P 500.
Results are gross of transaction costs and management fees. All returns are total returns and include the reinvestment of distributions (e.g., dividends).
1/1/1927 – 12/31/2015
The results are hypothetical results and are NOT an indicator of future results and do NOT represent returns that any investor actually attained. Indexes are unmanaged, do not reflect management or trading fees, and one cannot invest directly in an index. Additional information regarding the construction of these results is available upon request. These results were updated 5/10/2016.
The 50/50 portfolio, which always captures the diversification benefits of value and momentum, can be improved at the margin by using relative momentum across the two portfolios. However, there are (1) small costs of switching back and forth between the factors and (2) possible tax implications of making a 100% switch from value to momentum (or vice versa).
Big picture — a static value and momentum portfolio has known diversification benefits, as one factor tends to work well when the other factor is performing poorly. If one attempts to “time” factors, relative strength is a decent idea. However, when it comes to value and momentum, we recommend that investors don’t get cutesy: 1) invest in concentrated value; 2) invest in concentrated momentum; 3) exploit portfolio benefits (50/50 portfolio); 4) have long horizon. We provide the tools and the products to facilitate.
Active equity investing really isn’t that complicated, but it sure isn’t easy.
Endnotes
*We aren’t the only researchers to suggest this course of action. For example, we recommend readers explore the paper, “Value and Momentum Everywhere,” which is outstanding.
Appendix — Net of Fee returns
We examine the returns from 1927-2015 for 4 portfolios, taking fees off the portfolios for trading costs:
- 50% Value, 50% Momentum: A strategy that invests 50% in the Value portfolio and 50% in the Momentum portfolio described below. We assume the investor rebalances the portfolio to 50%/50% every month. This returns stream is net of the fees described below for value and momentum.
- Value: Top Decile of firms ranked on B/M from Ken French’s website. We use the value-weight portfolio returns and deduct 0.25% annually for the annual rebalance.
- Momentum: Top Decile of firms ranked on Intermediate-Term momentum (past 12 months excluding last month) from Ken French’s website. We use the value-weight portfolio returns and deduct 3.00% annually for the twelve monthly rebalances (0.25% per rebalance).
- SP500: The total return to the S&P 500, this return stream is gross of any fees.
Results are net of transaction costs and management fees described above. All returns are total returns and include the reinvestment of distributions (e.g., dividends).
1/1/1927 – 12/31/2015 (Net of Fees)
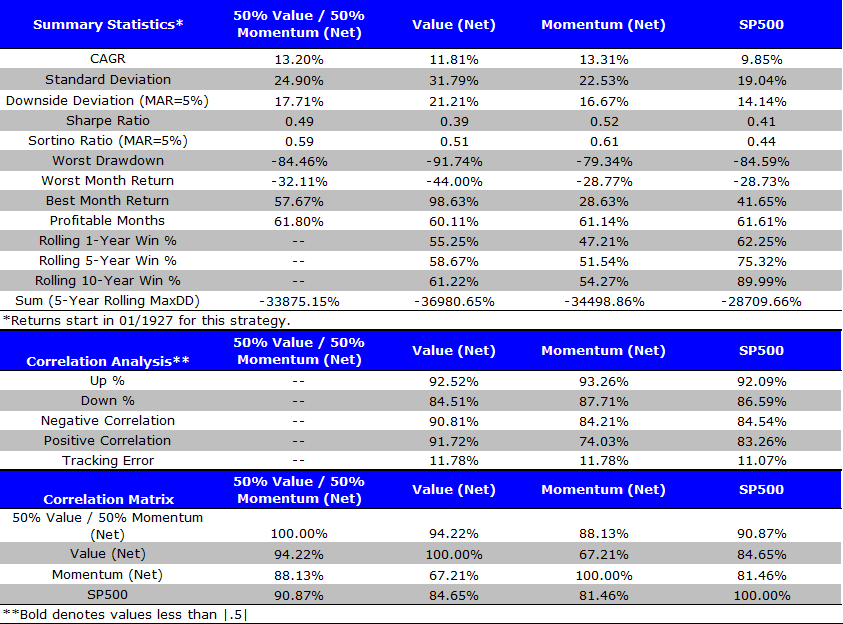
The results are hypothetical results and are NOT an indicator of future results and do NOT represent returns that any investor actually attained. Indexes are unmanaged, do not reflect management or trading fees, and one cannot invest directly in an index. Additional information regarding the construction of these results is available upon request.
The results (net of fees) are similar to the gross of fee table above, albeit with lower returns an investor would receive after accounting for transaction costs.
Below we split the study into first half and second half using the same fee assumptions.
First Half (1/1/1927 – 12/31/1973) Net of Fees

The results are hypothetical results and are NOT an indicator of future results and do NOT represent returns that any investor actually attained. Indexes are unmanaged, do not reflect management or trading fees, and one cannot invest directly in an index. Additional information regarding the construction of these results is available upon request.
Second Half (1/1/1974 – 12/31/2015) Net of Fees
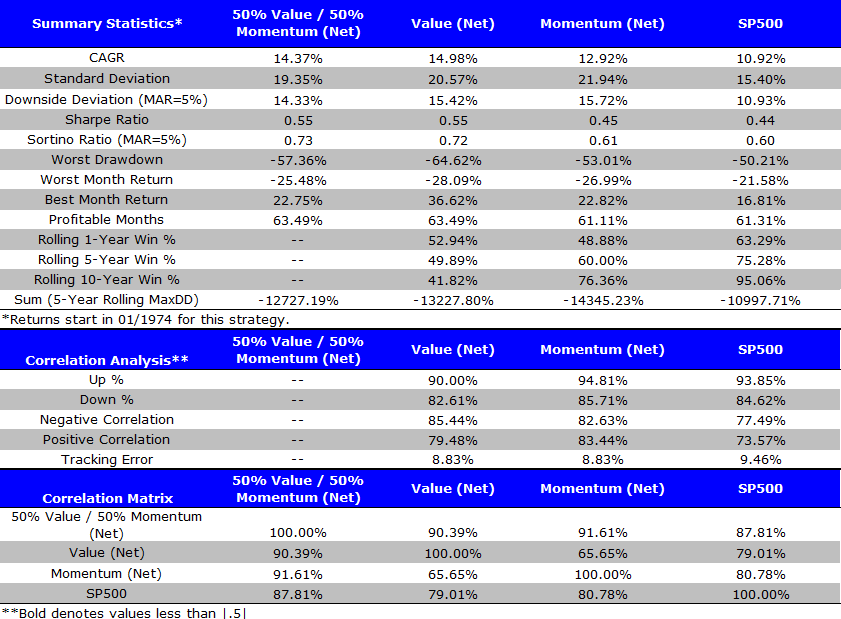
The results are hypothetical results and are NOT an indicator of future results and do NOT represent returns that any investor actually attained. Indexes are unmanaged, do not reflect management or trading fees, and one cannot invest directly in an index. Additional information regarding the construction of these results is available upon request.
About the Author: Jack Vogel, PhD
—
Important Disclosures
For informational and educational purposes only and should not be construed as specific investment, accounting, legal, or tax advice. Certain information is deemed to be reliable, but its accuracy and completeness cannot be guaranteed. Third party information may become outdated or otherwise superseded without notice. Neither the Securities and Exchange Commission (SEC) nor any other federal or state agency has approved, determined the accuracy, or confirmed the adequacy of this article.
The views and opinions expressed herein are those of the author and do not necessarily reflect the views of Alpha Architect, its affiliates or its employees. Our full disclosures are available here. Definitions of common statistics used in our analysis are available here (towards the bottom).
Join thousands of other readers and subscribe to our blog.