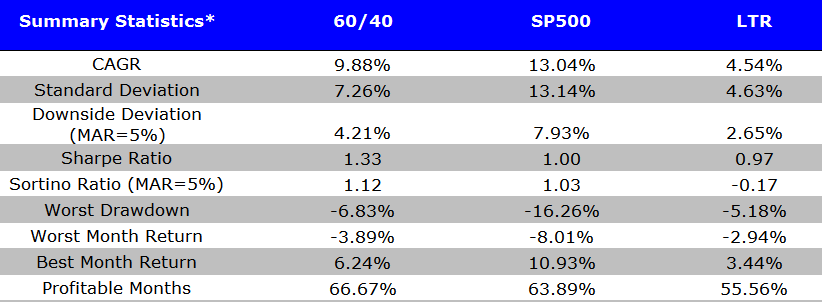
US-centric 60/40 portfolios have knocked it out of the park since 2010. Nearly a 10 percent compound annual growth rate, less than a 7 percent worst drawdown, and a Sharpe ratio of 1.33 (see below).
This is a 6 -year performance run that the highest paid hedge fund managers in the world would drool over. Incredible.
The summary stats below run from 1/1/2010 to 12/31/2015. Results are gross of fees. All returns are total returns and include the reinvestment of distributions (e.g., dividends). Monthly rebalanced to 60/40 weights. 60% S&P 500 Total Return Index and 40% 10-year Treasury Bond Total Return index.
- 60/40 = 60% SP500 and 40% LTR
- SP500 = S&P 500 total return
- LTR = 10-year treasury total return
Summary statistics

The results are hypothetical results and are NOT an indicator of future results and do NOT represent returns that any investor actually attained. Indexes are unmanaged, do not reflect management or trading fees, and one cannot invest directly in an index. Additional information regarding the construction of these results is available upon request.
Wow.
But let’s think about how this past performance might be currently influencing performance chasing fund flows…and of course, there is always the issue with long-term valuations…
As is always the case, who knows what the Market Gods will present, but the 5-10 year performance metrics for the domestic 60/40 buy-and-hold construct will be interesting out of sample.
About the Author: Wesley Gray, PhD
—
Important Disclosures
For informational and educational purposes only and should not be construed as specific investment, accounting, legal, or tax advice. Certain information is deemed to be reliable, but its accuracy and completeness cannot be guaranteed. Third party information may become outdated or otherwise superseded without notice. Neither the Securities and Exchange Commission (SEC) nor any other federal or state agency has approved, determined the accuracy, or confirmed the adequacy of this article.
The views and opinions expressed herein are those of the author and do not necessarily reflect the views of Alpha Architect, its affiliates or its employees. Our full disclosures are available here. Definitions of common statistics used in our analysis are available here (towards the bottom).
Join thousands of other readers and subscribe to our blog.

