Each morning we peruse a variety of research sites to see if there is anything exciting, new, and intriguing. Rarely does one find something that triggers a knee-jerk reaction like a recent paper by Hendrik Bessembinder.
The title almost FORCES you to read further:
Do Stocks Outperform Treasury Bills?
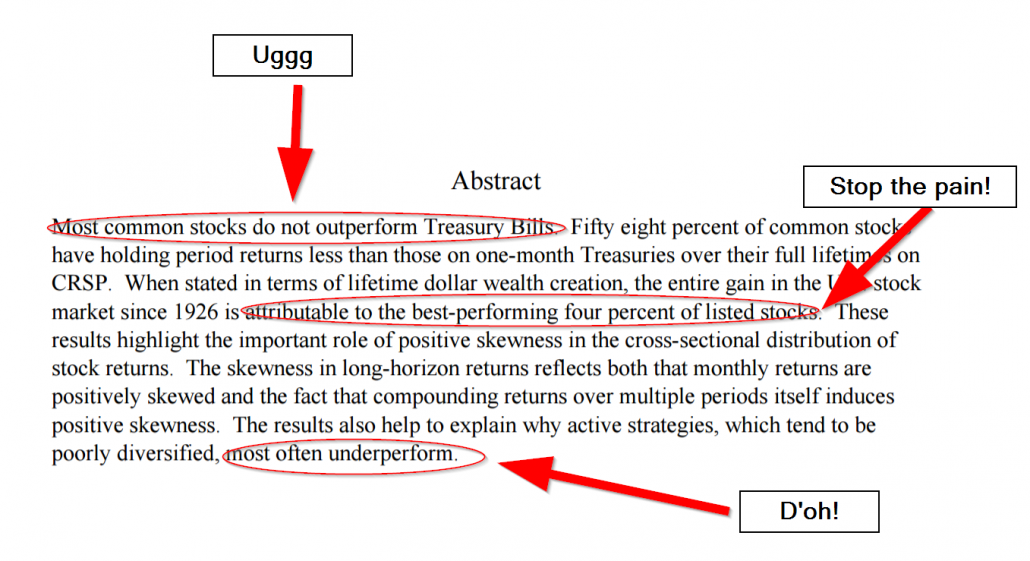
And the abstract reads like a horror film if you are an equity investor:
The good professor highlights that the distribution of stock returns is driven by a small percentage of really big winners.
Of course, this finding is not new:
- Our study on the distribution of stock returns
- The Longboard study on the distribution, “The Capitalism Distribution” (1)
However, Dr. Bessembinder pulls out all the stops and conducts a lot of incredibly interesting research into the details like only an academic writer can do (their job is primarily dedicated to research!).
A few facts/findings over the 1926 to 2015 time horizon:
- Only 47.7% of all monthly stock returns from the CRSP database (NYSE/AMEX/NASDAQ) are larger than the one-month Treasury rate.
- 42.1% of common stock holding period returns beat the holding return on T-bills.
- The 86 top-performing stocks — less 33bps of the entire universe — account for over half of the total wealth created.
- …and on and on…
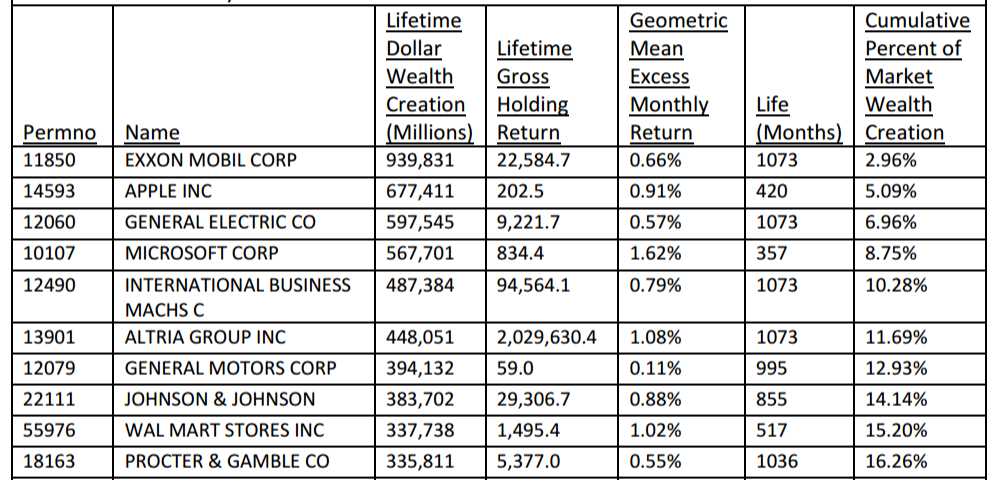
My favorite table is the last one, which maps out the top lifetime wealth creators in the US stock market:
The top 5– Exxon, Apple, GE, Microsoft, and IBM — account for over 10% of lifetime wealth on the entire stock market. The top 15 names account for 16.26% of total wealth EVER created in the US stock market.
Incredible. Dig in.
Do Stocks Outperform Treasury Bills?
- Hendrik Bessembinder
Fifty eight percent of CRSP common stocks have lifetime holding period returns less than those on one-month Treasuries. The modal lifetime return is -100%. When stated in terms of lifetime dollar wealth creation, the entire net gain in the U.S. stock market since 1926 is attributable to the best-performing four percent of listed stocks, as the other ninety six percent collectively matched one-month Treasury bills. These results highlight the important role of positive skewness in the cross-sectional distribution of stock returns. The skewness arises both because monthly returns are positively skewed and because compounding returns induces skewness. The results help to explain why active strategies, which tend to be poorly diversified, most often underperform.
About the Author: Wesley Gray, PhD
—
Important Disclosures
For informational and educational purposes only and should not be construed as specific investment, accounting, legal, or tax advice. Certain information is deemed to be reliable, but its accuracy and completeness cannot be guaranteed. Third party information may become outdated or otherwise superseded without notice. Neither the Securities and Exchange Commission (SEC) nor any other federal or state agency has approved, determined the accuracy, or confirmed the adequacy of this article.
The views and opinions expressed herein are those of the author and do not necessarily reflect the views of Alpha Architect, its affiliates or its employees. Our full disclosures are available here. Definitions of common statistics used in our analysis are available here (towards the bottom).
Join thousands of other readers and subscribe to our blog.


