When it comes to momentum investing, everyone is always looking for a better way to implement a momentum-based stock selection strategy (the same goes for a value strategy). We highlight a few methods in our book, Quantitative Momentum, as well as on our blog. We recently came across a paper from 2006 that has an improvement on a baseline momentum investing strategy, titled “Firm-specific attributes and the cross-section of momentum.”
The abstract is below:
This paper identifies observable firm-specific attributes that drive momentum. We find that a firm’s revenues, costs, and growth options combine to determine the dynamics of its return autocorrelation. We use these insights to implement momentum strategies (buying winners and selling losers) with both numerically simulated returns and CRSP/Compustat data. In both sets of data, momentum strategies that use firms with high revenue growth volatility, low costs, and valuable growth options outperform traditional momentum strategies by approximately 5% per year.
The Theory of Firm-Specific Information and Momentum Investing
The paper looks to improve a cross-sectional momentum strategy by incorporating firm-specific information. The goal of the paper is to see if there are certain conditions that exist which will cause a higher autocorrelation of returns at the firm-level. Why does this matter? Here is a direct quote from the paper:
The profitability of momentum strategies is a cross-sectional result: winners realize higher average returns than losers. Suppose one can identify firms with time-varying return autocorrelation and can restrict a momentum strategy to those firms whose autocorrelation is conditionally higher than average. Ceteris paribus, this restricted strategy results in enhanced profits because winners (losers) with relatively high autocorrelated returns have more persistent expected returns than winners (losers) from an unrestricted strategy.
This is a great idea — IF — one could actually identify when firms are more likely to have momentum.
The authors create theoretical models to see under which conditions a firm may produce a higher autocorrelation in returns. The authors use 3 variables: (1) revenue growth volatility, (2) costs of goods sold, and (3) book-to-market.
Their models yield the following conclusions:
- Momentum portfolios (long past winners and short past losers) formed from high revenue volatility firms will outperform momentum portfolios formed from low revenue volatility firms.
- Momentum portfolios (long past winners and short past losers) formed from low cost of goods (COGS) firms will outperform momentum portfolios formed from high cost of goods (COGS) firms.
- Momentum portfolios (long past winners and short past losers) formed from high-market-to-book firms will outperform momentum portfolios formed from low market-to-book firms.
So each of the three firm-specific information variables (revenue volatility, COGS, and B/M) predict conditions in the author’s model whereby the autocorrelation of returns will be conditionally higher, which would imply higher momentum returns due to a higher autocorrelation. Interested readers should investigate the paper in detail to view the theoretical models.
Testing the Models
To test the author’s models, which predict higher momentum profits depending on different characteristics, the authors split the universe via a sequential sort.
- First, they sort all firms with the necessary data (this includes small and micro-cap companies) into quartiles based on each of the three firm-specific information variables (revenue volatility, COGS, M/B).
- Next, within each quartile, they split firms into 20 portfolios based on their momentum, or past returns.
The process leads to a total of eighty portfolios. A nice graphical description of the double sort using M/B is shown in the paper (Figure 4 in the paper) and below:

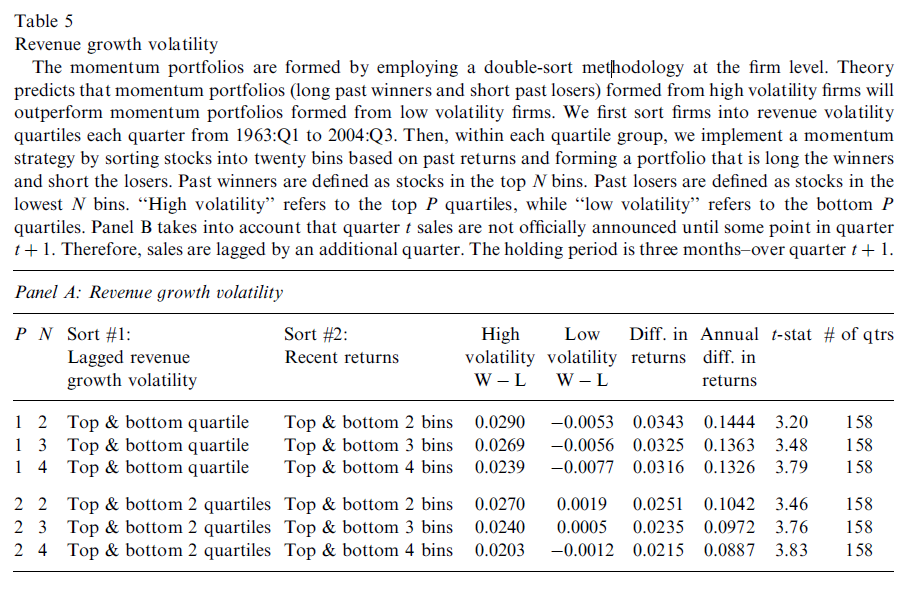
For each of the three factors, the authors run tests where they examine different combinations of portfolios and see how the long/short momentum returns perform. Tables 5, 6, and 7 show the returns to the portfolios formed first on Revenue Volatility, COGS, and M/B respectively. In each case, the results confirm the model’s prediction (perhaps not a surprise), and find that momentum profits are higher for firms with (1) higher revenue volatility, (2) lower COGS, and (3) higher M/B ratios. We show Table 5 below (Tables 6 and 7 show similar conclusions).
The results are hypothetical results and are NOT an indicator of future results and do NOT represent returns that any investor actually attained. Indexes are unmanaged, do not reflect management or trading fees, and one cannot invest directly in an index. Additional information regarding the construction of these results is available upon request.
Examining Table 5, we see that there is a positive momentum long/short return, and this is statistically significant. For example, examining the P=1 and N =4 sorts, or bottom and top revenue volatility quartiles (P=1) and the top/bottom four return bins (N=4), the high vol spread is 2.39% a quarter, whereas the low vol spread negative 0.77% a quarter. The authors compare this to Table 4, which shows the returns to the long/short momentum portfolio without examining any firm-specific information (1.06% a quarter). On average, the long/short momentum portfolios conditioned on firm-specific information outperform the simple long/short momentum portfolios.
Conclusion
The paper introduces a nice model and theory, which at the outset makes a ton of sense — try to find a subset of stocks where the autocorrelation should be conditionally higher, as this would lead to higher momentum profits. They find that incorporating firm-specific information in the momentum screen can enhance profits.
So what to make of the results? For a long/short momentum investing portfolio, this may be worth investigating. Unfortunately the paper does not show the long-only portfolio returns, which makes analysis/conclusions for a long-only investor more difficult without running the data. For long-only momentum investors, we highlight some improvements here.
Firm-specific attributes and the cross-section of momentum
Sagi and Seasholes
A version of the paper can be found here and here.
Want a summary of academic papers with alpha? Check out our Academic Research Recap Category.
Abstract:
This paper identifies observable firm-specific attributes that drive momentum. We find that a firm’s revenues, costs, and growth options combine to determine the dynamics of its return autocorrelation. We use these insights to implement momentum strategies (buying winners and selling losers) with both numerically simulated returns and CRSP/Compustat data. In both sets of data, momentum strategies that use firms with high revenue growth volatility, low costs, and valuable growth options outperform traditional momentum strategies by approximately 5% per year.
About the Author: Jack Vogel, PhD
—
Important Disclosures
For informational and educational purposes only and should not be construed as specific investment, accounting, legal, or tax advice. Certain information is deemed to be reliable, but its accuracy and completeness cannot be guaranteed. Third party information may become outdated or otherwise superseded without notice. Neither the Securities and Exchange Commission (SEC) nor any other federal or state agency has approved, determined the accuracy, or confirmed the adequacy of this article.
The views and opinions expressed herein are those of the author and do not necessarily reflect the views of Alpha Architect, its affiliates or its employees. Our full disclosures are available here. Definitions of common statistics used in our analysis are available here (towards the bottom).
Join thousands of other readers and subscribe to our blog.