Some things in life are naturally made for each other.
Some examples include the following:
So my ears perked up when the idea of combining VIX levels and Trend Following started making the rounds on finance twitter. Like any geek, I was eager to start testing the idea, knowing ahead of time that there is a major overfitting hurdle to surpass when combining signals. Nonetheless, the research and summary results are below.
Theory of Combining VIX and Trend
The are many potential theories underlying the integration of volatility and trend-following signals. I list some concepts and associated hypothesis below:
- Trend Following in its simplest form comes down to using information (asset price history) from the market to determine if an asset is appreciating or falling in price.
- If an asset is increasing in price, it is likely to continue, so you may want to own the asset. If an asset is decreasing in price, you may want to own a relatively stronger asset, and when no assets are increasing in price, then you may want to own cash.
- Therefore, trend following can be somewhat binary in nature – you either own the asset or you don’t. However, sometimes the signal may be hard to interpret because the asset price history has been positive, but highly volatile. Information Theory is a whole field of study about how to extract a signal from noise and can be very helpful in this regard.
- One of the helpful insights in Information Theory is to add mutual information to a particular signal. This happens all the time:
- Potential value investments are further parsed by a quality variable.
- Potential momentum investments are further parsed by a price consistency variable.
- Hypothesis: Incorporating VIX into a trend following signal is similar to adding a price consistency variable to a momentum portfolio, and therefore could plausibly enhance the signal’s power.
Testing a System of VIX & Trend
There are many possible ways to incorporate VIX (or the expected volatility of an asset) into a portfolio with trend following. Here is one idea from David Varadi using just the S&P 500 index. Although David’s idea is compelling, for this research idea I am more interested in how VIX and trend can be combined in a multi-asset framework.
The proposed system is as follows:
- Use assets that are commonly found in a retirement plan:
- S&P 500 TR index (US Large Cap Stocks)
- Dow Jones US Completion Index TR (US Small Cap Stocks)
- MSCI EAFE NR Index (International Stocks)
- US BBergBarCap TR Index (US Bonds)
- 30 Day US T-Bill TR Index (Cash)
- Use VIX Index from the CBOE for a signal. VIX data is somewhat limited so results start on March 1990 and run through July 2017.
- Use the following signals for VIX:
- Green – If the 40 day simple moving average of VIX is 18 or below.
- Yellow – If the 40 day simple moving average of VIX is above 18 AND the 20 day simple moving average of VIX is below 32.
- Red – If the 40 day simple moving average of VIX is above 18 AND the 20 day simple moving average of VIX is above 32.
- Use the following trend following rules:
- If the VIX signal is Green then – use performance over the following 10 months and own the top 1 or 2 assets. If the returns on either are negative then cash is held in its place.
- If the VIX signal is Yellow then – use performance over the following 3 months and own the top 1 or 2 assets. If the returns on either are negative then cash is held in its place.
- If the VIX signal is Red then – use performance over the following 1 month and own the top 1 or 2 assets. If the returns on either are negative then cash is held in its place.
For the sake of comparison, the system (above) is compared against a more simple trend following system that owns the top 1 or 2 assets over the last 10 months and if either the top 1 or 2 assets over the last 10 months is negative then the portfolio is invested in cash.
VIX and Trend-Following System Summary Results
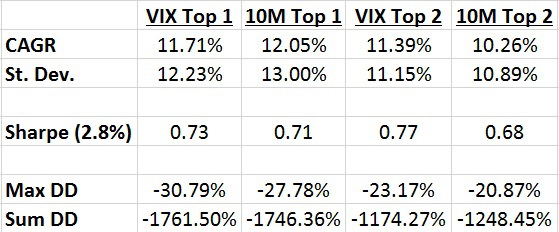
The following show the results for the system (VIX top 1 and VIX top 2) as well as the performance of our benchmark (10M top 1 and 10M top 2):

The results are hypothetical results and are NOT an indicator of future results and do NOT represent returns that any investor actually attained. Indexes are unmanaged, do not reflect management or trading fees, and one cannot invest directly in an index.
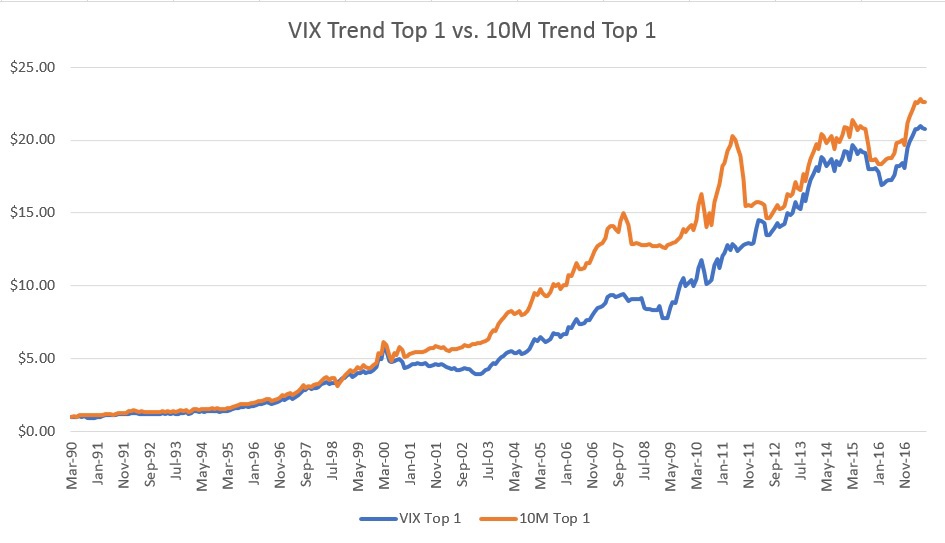
What we see from the results above is that there isn’t really a noticeable difference between the performance of VIX Top 1 (portfolio that uses the VIX signals to inform which trend signal to use and then buy the best performing asset that matches that trend signal over the next month) and 10M Top 1 (always buys the best performing asset over the prior 10 months and if the performance is negative then hold cash). The return of the two had very similar gross returns (11.71% vs. 12.05%), standard deviation (12.23% vs. 13.00%), Sharpe Ratio (0.73 vs. 0.71) and even have very similar drawdown statistics.
Here is a visual representation of the results, above:

The results are hypothetical results and are NOT an indicator of future results and do NOT represent returns that any investor actually attained. Indexes are unmanaged, do not reflect management or trading fees, and one cannot invest directly in an index.
So far, this would seem to be a case of the “added complexity doesn’t add much” to portfolio results.
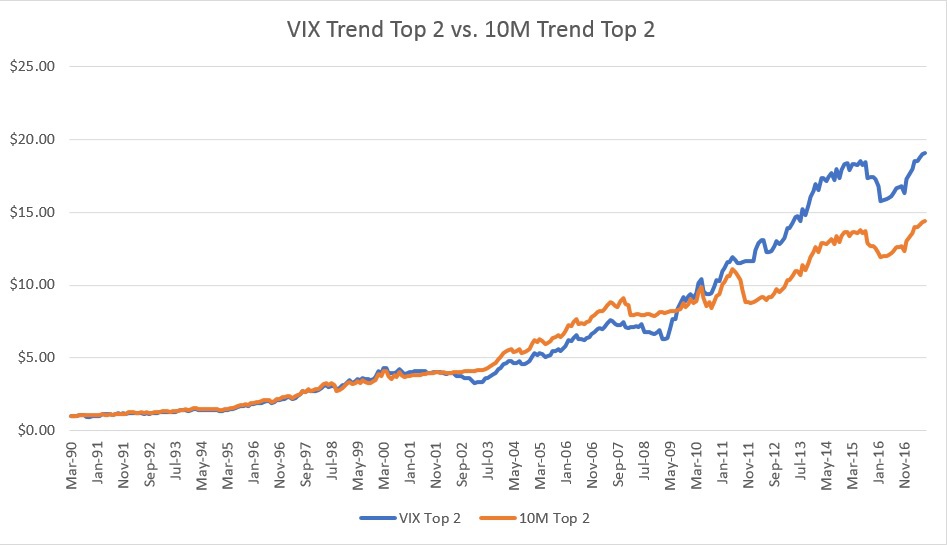
There does appear to be some benefit to the added complexity as VIX Top 2 has an almost 1% gross return improvement from the more simple 10M Top 2. This improvement in return doesn’t come at the cost of a meaningful increase in standard deviation as they are still very similar (11.15% vs. 10.89%). This means that VIX Top 2 has a nice increase in Sharpe Ratio vs. 10M Top 2 (0.77 vs. 0.68). Despite the apparent improvement in return and volatility statistics, there is still no meaningful difference in drawdown statistics between VIX Top 2 and 10M Top 2.
Here is a visual representation of the VIX Top 2 and 10M Top 2:

The results are hypothetical results and are NOT an indicator of future results and do NOT represent returns that any investor actually attained. Indexes are unmanaged, do not reflect management or trading fees, and one cannot invest directly in an index.
Conclusion
The idea of incorporating VIX (or the volatility of a price signal) into a trend following strategy sounds compelling in theory, but as Yogi Berra is found of saying:
In theory there is no difference between theory and practice, in practice there is.
In this post, we attempt to put theory into practice and find the results to be mixed – using only 1 asset the added complexity doesn’t appear to be helpful. However, using 2 assets to implement the system appears to warrant further research.
Let us know what you think!
Appendix 1
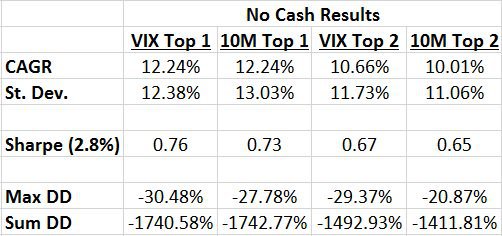
I was recently asked how the results change when cash is excluded as an investment option when other assets would otherwise warrant using cash. I have updated the performance data and included, below:

The results are hypothetical results and are NOT an indicator of future results and do NOT represent returns that any investor actually attained. Indexes are unmanaged, do not reflect management or trading fees, and one cannot invest directly in an index.
Conclusion
As you can see from the table, the VIX Top 1 CAGR improves but only by 0.53% and the Sharpe ratio improves but only by 0.03. The Max Draw Down and Sum of All Draw Downs are largely unchanged.
The VIX Top 2 results all decline when compared to when cash is available as an investment option.
The exclusion of cash doesn’t seem to be a robust way to improve the performance of using VIX and trend in combination.
About the Author: Andrew Miller
—
Important Disclosures
For informational and educational purposes only and should not be construed as specific investment, accounting, legal, or tax advice. Certain information is deemed to be reliable, but its accuracy and completeness cannot be guaranteed. Third party information may become outdated or otherwise superseded without notice. Neither the Securities and Exchange Commission (SEC) nor any other federal or state agency has approved, determined the accuracy, or confirmed the adequacy of this article.
The views and opinions expressed herein are those of the author and do not necessarily reflect the views of Alpha Architect, its affiliates or its employees. Our full disclosures are available here. Definitions of common statistics used in our analysis are available here (towards the bottom).
Join thousands of other readers and subscribe to our blog.
