There are now hundreds of factors in what John Cochrane famously called the “zoo of factors.” However, there are only a small number that meet the requirements for investment that my co-author, Andrew Berkin, and I establish in our book, “Your Complete Guide to Factor-Based Investing”: persistence, pervasiveness, robustness, implementability, and intuitiveness. Momentum (both cross-sectional and time-series), along with market beta, size, value and profitability/quality, are the equity factors that meet that criteria.
As we demonstrate in the book, there is a wealth of academic evidence and behavioral theory on the efficacy and intuition behind momentum investing. For example, according to data from the Fama/French Data Library and AQR, from 1927 through 2016, the annual cross-sectional momentum — the phenomenon that securities that have performed well relative to their peers (winners) over the recent period tend to continue to outperform, and securities that have performed relatively poorly (losers) tend to continue to underperform — premium in U.S. stocks was 8.1 percent, virtually identical to the U.S. market beta premium of 8.2 percent over the same period. In addition, as the table below shows, over the same period the cross-sectional momentum premium was highly persistent.
Odds of Momentum Outperformance (%)
| 1-Year | 3-Year | 5-Year | 10-Year | 20-Year |
|---|---|---|---|---|
| 72% | 86% | 90% | 97% | 100% |
Source: Fama/French Data Library and AQR. The results are hypothetical results and are NOT an indicator of future results and do NOT represent returns that any investor actually attained. Indexes are unmanaged, do not reflect management or trading fees, and one cannot invest directly in an index. Additional information regarding the construction of these results is available upon request.
In addition to the large premium, and the high level of its persistence, another benefit of cross-sectional momentum is that it has been negatively correlated to the value premium (from 1964 through 2016, the correlation was -0.23). Thus, momentum tends to outperform when value underperforms (and vice versa), yet both have outperformed the market over time. Combining styles that tend to outperform the market on average, but at different times, results in portfolios that have more potential for consistent market outperformance.(1)
In terms of long-only momentum strategies, the historical outperformance relative to the benchmark index has been an average gross return of around 1 percent to 1.5 percent per year over the benchmark.
Running Momentum Portfolios in the Real World
Unfortunately, there has been a paucity of research on the feasibility of running momentum portfolios in the real world, where costs matter. The lack of evidence has called into question the ability to capture the premium in the live portfolios. And given momentum strategies’ high turnover, implementation costs could overwhelm any “paper” premiums, especially for taxable accounts. Ronen Israel, Tobias Moskowitz, Adrienne Ross and Laura Serban contribute to the literature with their 2017 study, “Implementing Momentum: What Have We Learned?”, in which they analyzed implementation costs for live momentum portfolios, AQR’s own momentum funds, over a seven-year period.(2)(3)
Relative to momentum-based index funds, AQR’s momentum funds, which began life in July 2009, utilize a number of more sophisticated portfolio construction decisions meant to improve expected net returns. In particular, their live strategies utilize an evolved model that includes multiple measures of momentum (both short- and long-term) and rebalances more frequently than the indices (monthly rather than quarterly). In addition, the live strategies include additional controls to manage liquidity, turnover and transaction costs, as well as other risk-management concerns. In terms of trading costs, AQR employs a number of techniques that can be used to manage them for any live strategy (not just momentum), including an optimization framework that seeks to minimize transaction costs per dollar traded.
For example, the model allows trade substitutions across stocks with similar momentum characteristics and for replacing securities that are expensive to trade with those that are cheaper to trade. This substitution is based on expected trading costs that are, in turn, a function of expected participation rate (i.e., trade size as a fraction of daily volume traded) and information about stock characteristics and market conditions. They also use algorithmic patient-trading strategies to minimize market impact costs.
In addition to trying to add value through more sophisticated trading strategies, AQR tries to add value through portfolio construction rules. For example, their rules include tilting toward stocks with higher momentum versus a pure market-capitalization weighting scheme, as well as adding momentum metrics that go beyond the simple academic definition of price momentum, such as momentum around earnings announcements or momentum based on residual rather than total returns.
The authors, who are affiliated with AQR, sought to answer the question: How much did implementation costs impact the returns from momentum investing over the seven years of live performance? To find the answers, they compared the returns of their live funds relative to the theoretical momentum benchmark index.
The following is a summary of their findings, which cover the period from July 2009 through 2016:
- Over the live period, the strategy outperformed the index (which has no costs) in U.S. large caps (AMOMX) by 0.9 percent, but underperformed in U.S. small caps (ASMOX) and international stocks (AIMOX) by -1.2 percent and -1.1 percent, respectively.
- Expenses explain a large portion of the difference in performance between the live strategy and the theoretical momentum indices, subtracting 44, 60 and 58 basis points (bps) for the U.S. large-cap, U.S. small cap and international strategies, respectively — a simple average of 54 basis points. The expenses are now generally slightly lower, at 40, 60, and 55 bps, respectively, or an average of 52 bps.
- Momentum strategies experienced roughly 80 percent to 90 percent average one-sided net turnover per year over their live period.
- Trading costs subtracted 12, 32 and 25 bps, for the U.S. large-cap, U.S. small cap and international strategies, respectively — a simple average of 23 bps.
- General market conditions, like market volatility as measured by VIX, which was highest in the first half of 2009 and second half of 2011, showed little relation to market impact costs, which were at low to medium levels in those periods.
- Portfolio construction rules added 142 bps to the return of the U.S. large-cap fund, but subtracted 28 bps and 24 bps from the returns of the U.S. small-cap and international funds — a simple average of 30 bps.
The 23 bps average cost for trading refutes the argument that excessive turnover renders momentum prohibitively expensive to successfully implement.
The authors concluded:
In practice, long-only momentum investing does not have to produce excessive turnover, large trading costs, or significant tax burdens that prohibit capturing the momentum premium — showing that momentum is an implementable strategy.
Here is a chart from Israel, Moskowitz, Ross and Serban’s 2017 paper highlighting the overall trading costs over time for the AQR momentum strategies:
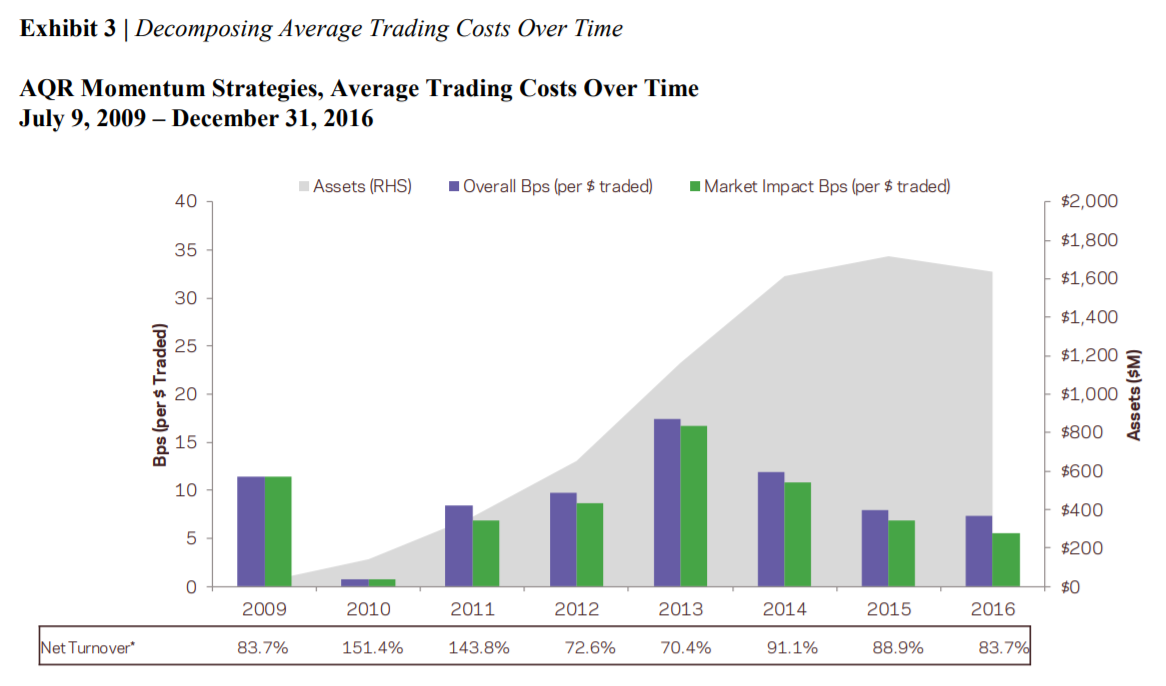
The results are hypothetical results and are NOT an indicator of future results and do NOT represent returns that any investor actually attained. Indexes are unmanaged, do not reflect management or trading fees, and one cannot invest directly in an index. Additional information regarding the construction of these results is available upon request.
The Tax Efficiency of Momentum Strategies
The authors also address the concern about momentum strategies’ tax efficiency, which could be negatively impacted by their relatively high turnover. They note that, by design, momentum tends to hold winners longer and sell losers more quickly, which means it realizes short-term losses and generates more long-term capital gains than short-term capital gains, both of which are tax advantageous. In addition, momentum stocks tend to have a relatively lower dividend yield than value or defensive stocks, and hence will generate lower income tax. They also cite research showing that momentum is more amenable to tax optimization compared to other styles, such as value and defensive, because it is more efficient to make trade-offs across long-term versus short-term capital gains and losses without incurring meaningful style drift. Momentum is a more substitutable characteristic than, say, value from a tax-optimization perspective, in the sense that it is easier to find similar momentum stocks with different tax liabilities than it is to find a similar value stock with very different tax consequences.
Below is a table, again from Israel, Moskowitz, Ross and Serban’s 2017 paper, highlighting the results associated with tax and momentum strategies:
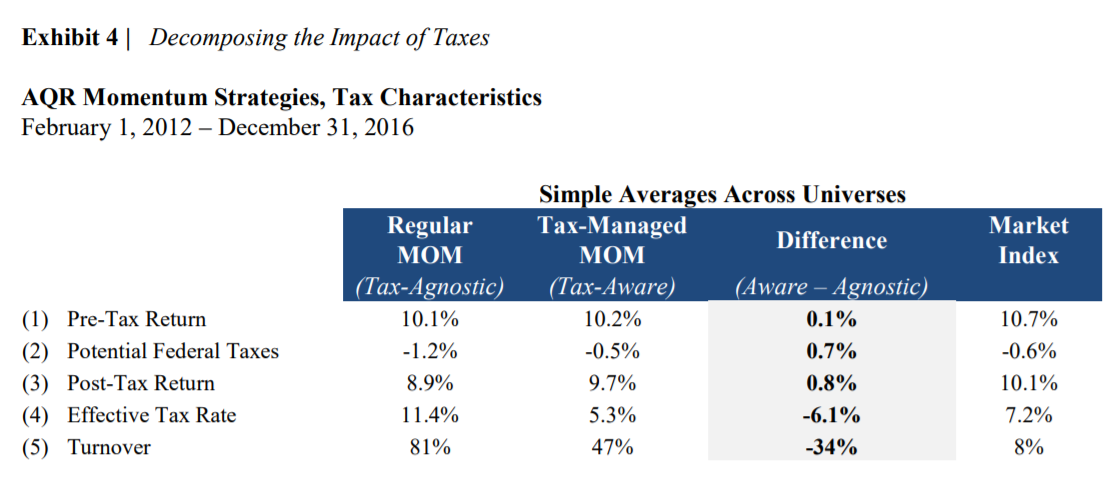
The results are hypothetical results and are NOT an indicator of future results and do NOT represent returns that any investor actually attained. Indexes are unmanaged, do not reflect management or trading fees, and one cannot invest directly in an index. Additional information regarding the construction of these results is available upon request.
In January 2012, AQR launched tax-aware strategies for each of the aforementioned asset classes (U.S. large and small caps and international). The tax-management techniques include deferring realizations of capital gains and attempting to generate long-term capital gains, accelerating the realization of short-term losses to offset realized gains, and limiting portfolio turnover that may result in taxable gains. While these strategies are expected to have a small negative impact on pre-tax returns, they should add to after-tax returns. They are, of course, designed for use by taxable investors in taxable accounts.
From February 2012 through December 2016, on average, the three tax-aware strategies reduced turnover by 34 percentage points (from 81 percent to 47 percent) — and by implication trading costs — and federal taxes by 0.7 percentage points (from 1.2 percent to 0.5 percent). And the small expected loss in pretax returns was not realized (helped by lower trading costs). In fact, the pretax return averaged 0.1 percent higher for the tax-aware strategies. The effective tax rate fell from 11.4 percent to just 5.3 percent, which was even less than the 7.2 percent rate for a market portfolio, despite market portfolios’ much lower turnover (with the benchmarks for a market portfolio being the ETFs IWB for U.S. large caps, IWM for U.S. small caps and a weighted combination of EFA and EWC for international).
In addition, the correlation of returns of the two strategies was 0.97. The authors concluded: “These results illustrate the feasibility and benefits of tax-optimization for momentum strategies. The TM strategies have captured a similar return premium as the regular MOM strategies in a tax-efficient manner, further evidenced by the high correlation of excess returns (> 0.95) and low realized tracking error (< 1%).”
It should be noted that while the tax consequences of momentum can be managed fairly effectively, there are also structural solutions to the tax problem. For example, with the advent of the ETF structure, the tax efficiency of momentum strategies is less of a concern and the need to build constrained momentum strategies is no longer a binding constraint.
Summary
While seven years of live experience is still too short to evaluate the efficacy of a style portfolio such as momentum (i.e., what is the true gross momentum premium?), it is sufficient to learn something about its implementability in practice. Israel, Moskowitz, Ross and Serban demonstrate that live momentum portfolios are capable of capturing the momentum premium, even after accounting for expenses, estimated trading costs, taxes and other frictions associated with real-life portfolios. Their results demonstrate both that momentum is an implementable strategy and that the live trading experience has not necessarily produced excessive turnover, large trading costs or significant tax burdens. These results contradict common myths about momentum investing.
References[+]
| ↑1 | Alpha Architect has a wealth of research and articles on momentum here. |
|---|---|
| ↑2 | Alpha Architect has an in-depth discussion of factors and trading costs here. |
| ↑3 | Full disclosure: My firm, Buckingham Strategic Wealth, recommends AQR funds in constructing client portfolios. |
About the Author: Larry Swedroe
—
Important Disclosures
For informational and educational purposes only and should not be construed as specific investment, accounting, legal, or tax advice. Certain information is deemed to be reliable, but its accuracy and completeness cannot be guaranteed. Third party information may become outdated or otherwise superseded without notice. Neither the Securities and Exchange Commission (SEC) nor any other federal or state agency has approved, determined the accuracy, or confirmed the adequacy of this article.
The views and opinions expressed herein are those of the author and do not necessarily reflect the views of Alpha Architect, its affiliates or its employees. Our full disclosures are available here. Definitions of common statistics used in our analysis are available here (towards the bottom).
Join thousands of other readers and subscribe to our blog.