Factor investing, and the associated intellectual battles, have raged for decades in academic finance journals. However, now that factor investing has gone mainstream via ETFs, the debate has broader interest among the investing public. In this paper we discuss this key question: Do factor portfolios survive transaction costs?
Some investors question the very existence of factor premiums. We are sympathetic to this viewpoint given the noise around poor factor replication and the potential for data-mining (although we think they are wrong).
However, one thing is clear: it is hard to have a factor debate with those who fall in the “factors don’t exist” camp. So let’s move past this debate and discuss another debate among those investors who believe factors exist.
Factor Portfolios and Transaction Costs
Among those who believe in the potential of factor investing, there is debate around a simple question:
Do factor portfolios survive transaction costs?
Turns out this question does not have a simple answer.
Some commentators, such as our friend Gary Antonacci, highlight research which suggests that factor strategies have very limited capacity before transaction costs.
On the flip side, we have spotlighted research and we have constructed focused factor indexes, which argue that factor capacity, while not infinite, is certainly investable.(1)
Are we crazy to believe that factors have some investable capacity? Possibly, but the answer to this question will depend on who you ask.
For example, consider the momentum factor, where the estimated capacity ranges from $5B to over $300B — a wide range to say the least!(2)
In this piece, we’ll try and summarize the key research and ideas that will help readers ascertain the intellectual “truth.”(3)
The essay is broken into two core sections:
- Microstructure transaction cost analysis via high-frequency trading data
- Inferred transaction cost analysis via fund manager performance data
For the microstructure transaction cost analysis we examine multiple academic papers that attempt to model out trading costs, using TAQ data, which is the core dataset available for academic researchers via the WRDS. platform(4)
We also look at 2 papers that use live high-frequency transaction data from Blackrock and AQR. The conclusion from this research is that factor investing has limited capacity, but there is a substantial debate over the actual capacity levels.
The second attempt at tackling the question of how transaction costs affect factor portfolios is to look at the performance of live fund managers to back out, or infer, transaction cost estimates. These research papers examine trading costs via a two-pass Fama-Macbeth regression technique. The novel idea behind this approach is that one does not need to “model” trading costs and look at cumbersome high-frequency execution data, rather, via the Fama-Macbeth regression framework, one can learn the true transaction costs under various assumptions. This vein of research seeks to compare “realized factor premiums” to hypothetical factor premiums to determine the “net factor premium” received by actual fund managers. The conclusion from this research is one-sided: factor premiums are shaky at best, net of transaction costs. Below we perform an extended analysis of these research papers.
Where does this all lead us in our quest to answer the question: Do factor portfolios survive transaction costs?
Well, there are no definitive answers, but we come to the following conclusions:
- Factors have capacity constraints.
- One can learn little about transaction costs via two-pass regression procedures.
Let’s dig into the papers on trading costs.
A PDF version of this is available here.
Summary of Microstructure Transaction Cost Papers
So what does the research say about trading costs? As mentioned above, it depends on who you ask.
Results Using TAQ data (Dataset available to academic researchers)
First, there are a handful of studies done using trading-execution estimates from the NYSE Trade and Quote (TAQ) database (available for academic researchers via WRDS).
A few of these papers are listed below:
- The Illusory Nature of Momentum Profits by Lesmond, Schill, and Zhou (2003)
- Are Momentum Profits Robust to Trading Costs? by Korajczyk and Sadka (2003)
- A Taxonomy of Anomalies and their Trading Costs” by Novy-Marx and Velikov (2015)
We have discussed the last paper on our website here. Here is the abstract of the paper:
We study the after-trading-cost performance of anomalies, and effectiveness of transaction cost mitigation techniques. Introducing a buy/hold spread, with more stringent requirements for establishing positions than for maintaining them, is the most effective cost mitigation technique. Most anomalies with turnover less than 50% per month generate significant net spreads when designed to mitigate transaction costs; few with higher turnover do. The extent to which new capital reduces strategy profitability is inversely related to turnover, and strategies based on size, value, and profitability have the greatest capacities to support new capital. Transaction costs always reduce strategy profitability.
All three papers above come to similar conclusions — trading costs reduce factor premiums, and momentum, the so-called “premier anomaly,” suffers the most from transaction costs, leaving it with a fairly low capacity and questionable after-frictional-cost performance.
Here is Table 7 of the Novy-Marx and Velikov paper:
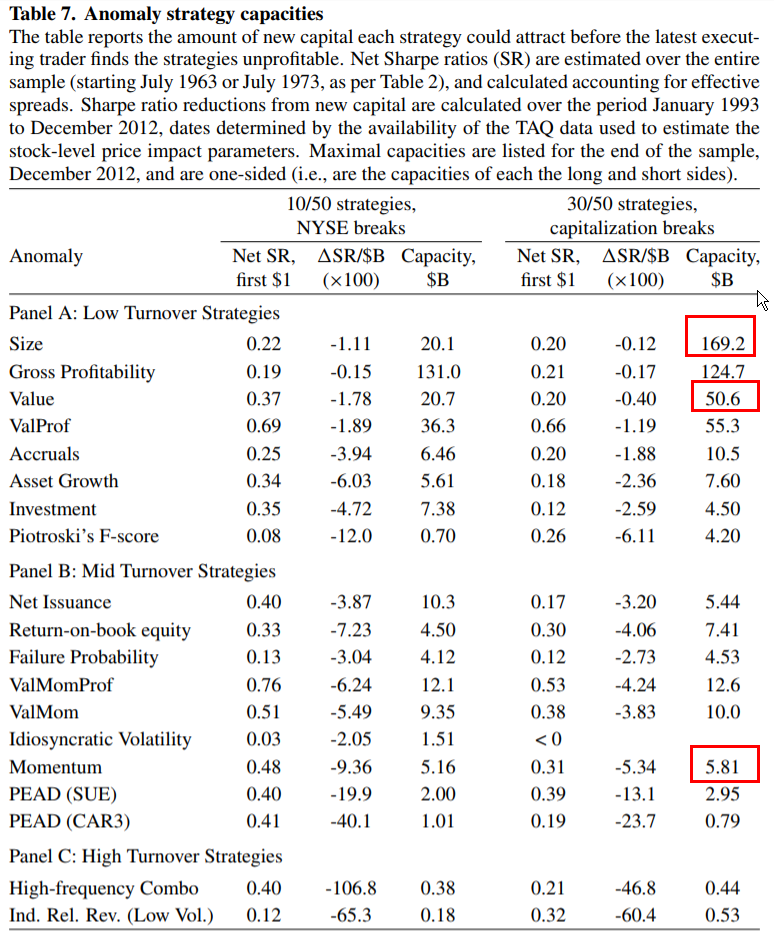
The results are hypothetical results and are NOT an indicator of future results and do NOT represent returns that any investor actually attained. Indexes are unmanaged, do not reflect management or trading fees, and one cannot invest directly in an index. Additional information regarding the construction of these results is available upon request.
Note, that the capacity of momentum is only $5.81B, which is a relatively small amount of capital in a global equity market with a multi-trillion dollar notional value.
Results Using Practitioner Transaction Data
While the 3 papers mentioned above are in general agreement when it comes to limited capacity constraints on various factor strategies (especially with respect to momentum), there are two papers, that find strikingly different results. The key difference between these papers and the prior three papers discussed is related to the data source deployed.
The first paper is, “Capacity of Smart Beta Strategies: A Transaction Cost Perspective,” by Ratcliffe, Miranda, and Ang (2017), researchers connected to Blackrock (We discuss this paper here). This paper, using a proprietary transaction model and leverages high-frequency data compiled from Blackrock’s live trading transactions. The key finding is that there is a much larger capacity for momentum (and the other factor approaches) than what previous research had described.
Below are the capacity estimates assuming different premium levels and trading over 1-day.
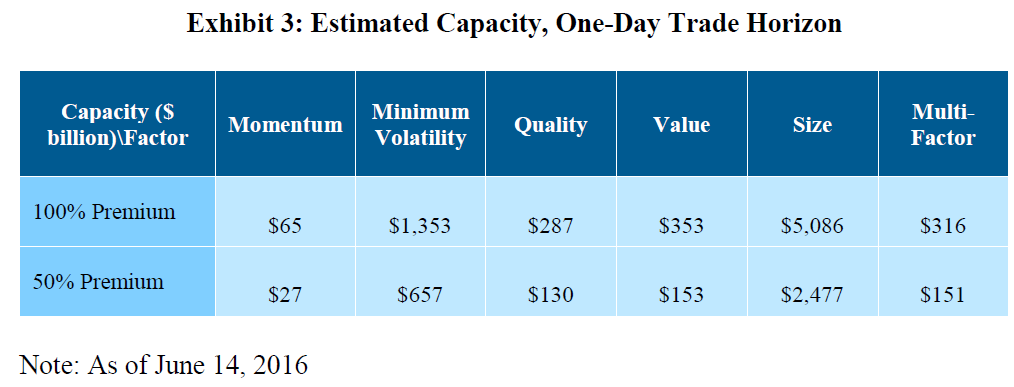
The capacity is estimated anywhere between $27B and $65B for momentum, which is almost a magnitude larger than the estimates from the prior papers.
But what if we allow the factor manager to trade into the positions over multiple days?
A multi-day trading and execution cycle is both reasonable and fairly typical for large asset managers.
The capacity estimates for this multi-day approach are posted below:
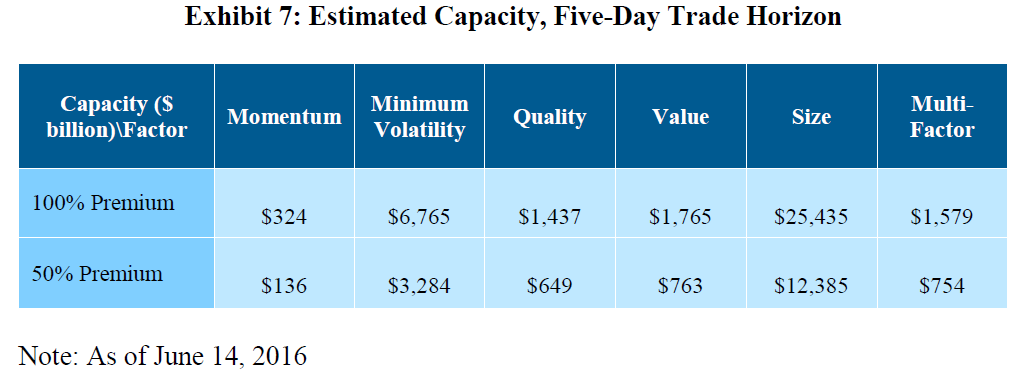
In a multi-day transaction cost model, the momentum factor strategy has a greatly expanded capacity limit that dwarfs the ~$5B capacity constraint from the original academic research on the subject.
Clearly, small differences in transaction costs models, and/or the underlying data fed into these models, can make a large difference for capacity estimates.
For another take from a practitioner-associated research piece, we can look at the analysis from, “Trading Costs of Asset Pricing Anomalies,” by Frazzini, Israel, and Moskowitz (2015) (the researchers are associated with asset manager AQR). This paper uses proprietary transaction data to estimate the transaction costs of trading factor-style stocks (value, momentum, etc.) (We dig into the paper in detail here).
The abstract of the paper is as follows:
Using over a trillion dollars of live trading data from a large institutional money manager across 21 developed equity markets over a 16-year period, we measure the real-world transactions costs and price impact function facing an arbitrageur and apply them to trading strategies based on empirical asset pricing anomalies. We find that actual trading costs are an order of magnitude smaller than previous studies suggest. In addition, we show that small portfolio changes to reduce transactions costs can increase the net returns and break-even capacities of these strategies substantially, with little tracking error. Use of live trading data from a real arbitrageur and portfolios designed to address trading costs give a vastly different portrayal of implementation costs than previous studies suggest. We conclude that the main capital market anomalies – size, value, and momentum – are robust, implementable, and sizeable in the face of transactions costs.
A key table from the paper highlights the capacity of the long/short momentum factor:
This paper finds the long-short momentum capacity to be $56.16B, which is magnitudes higher than the academic papers utilizing the TAQ dataset.
Who’s Right? The Ivory Tower Academics or the Conflicted Practitioners?
Research from AQR and Blackrock researchers uses real-world trading costs to assess trading costs on factor-investing styles. These authors find that capacity levels for the momentum factor are 10x higher than the estimates presented by the academic researchers before them.
Who are we to believe?
On one hand, the academics don’t have factor products to push into the market; on the other hand, the practitioners have actual transaction data that better reflects the real-world. Or as Gary Antonacci puts it:
…Like what happens when drug companies have academics do trials of their products, fund sponsors had their own researchers look at the capacity of factor-based strategies.
AQR provides a clever experiment to zero in on the ground truth, despite doing research that has a potential conflict of interest.
To identify which approach is more akin to reality, the AQR researchers conduct a “what-if” analysis using their transaction cost estimation approach versus the approaches of researchers using TAQ data to assess the estimated transaction costs associated with the implementation of the S&P 500 index portfolio. The image below highlights that the academic models/data are likely misspecified. Using the approach of the original academic researchers (with TAQ data) suggests that the annual trading costs for the SP500 would be 0.63%, while the data from AQR suggests trading costs are 0.06%. We can compare this AQR estimate to the known transaction costs from Vanguard (0.12% per the paper) and iShares (0.07% per the paper) associated with actually implementing portfolios that track the S&P 500.
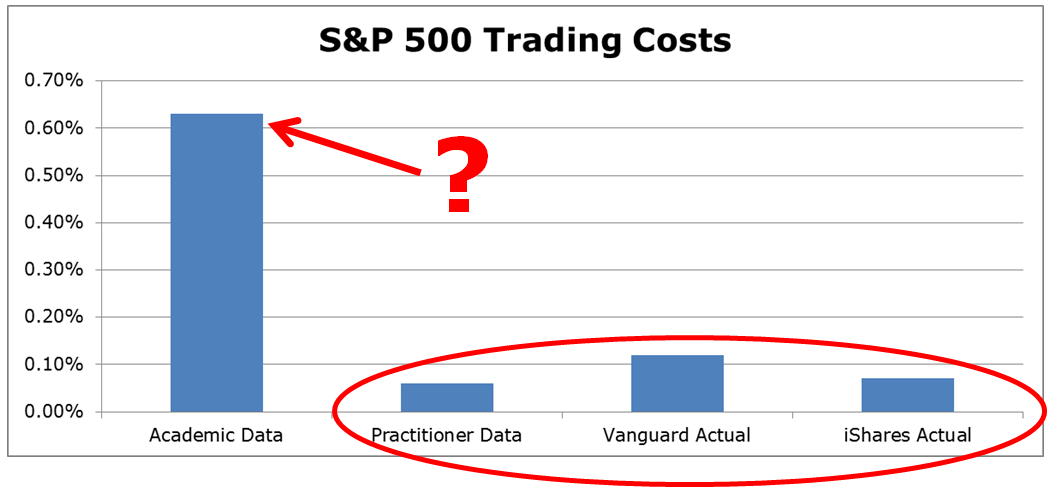
The analysis from AQR using live transaction data (and by extension, Blackrock) seems to paint a much clearer picture of reality, despite being conflicted. Unless the academic researchers can reconcile why it is so expensive to buy beta, when in fact, we know it is relatively cheap, the conflicted practitioner-associated researchers seem to be winning the argument that factor strategies have greater capacity than prior research has identified.
Transaction Cost Research Summary
In the end, a summary of the papers above highlights the following fact–depending on the model/data one chooses, the conclusion regarding factor capacity can vary wildly.
(5)Perhaps measuring transaction costs via microstructure data is an example of trying too hard?
What if there were a way to measure trading costs without a model?
This novel idea was first proposed by Research Affiliates (RAFI), and we dig into the idea below.
Ditch the High-Frequency Data and Measure Trading Costs Via Performance?
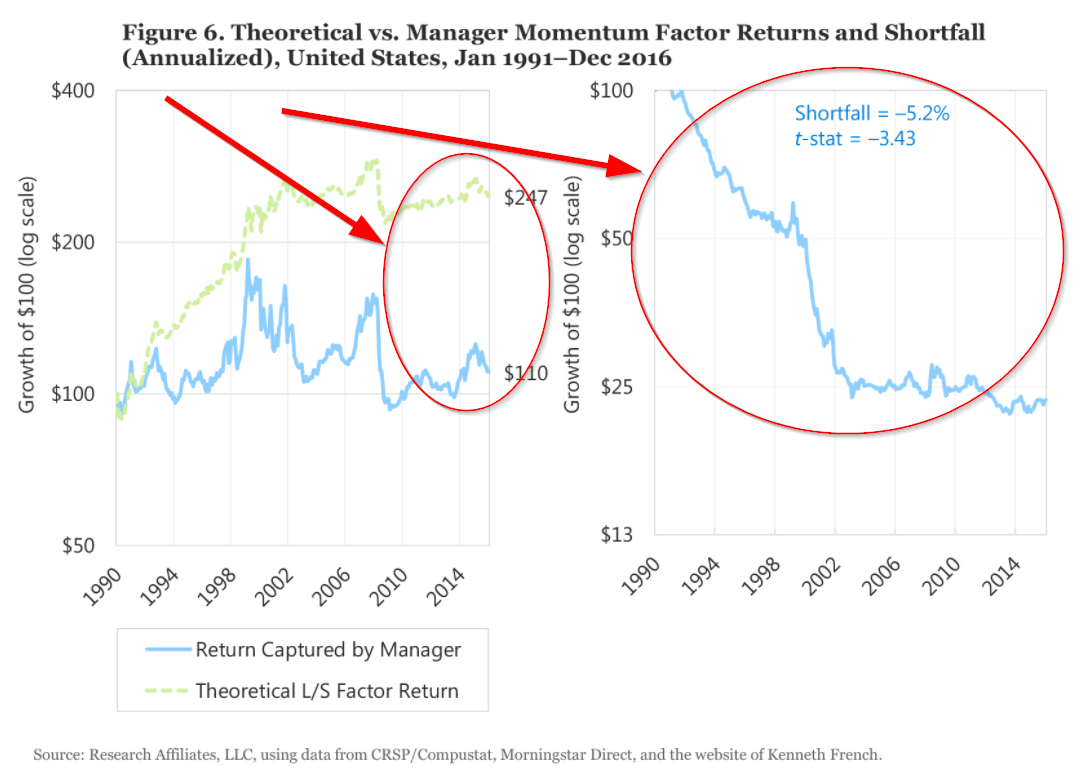
Earlier this year, the Research Affiliates team (Rob Arnott, Vitali Kalesnik, and Lilian Wu) came out with a provocatively titled paper, “The Incredible Shrinking Factor Return” (“RAFI paper”). The researchers came up with a novel approach to identify if investors can exploit factors after transaction costs. Their solution to the puzzle is to bypass transaction cost analysis and simply review live portfolio results. The authors utilize a two-stage regression, also known as a Fama-MacBeth regression on live, net-of-fee returns of mutual funds over the 1991-2016 time period.
How does a two-stage regression propose to identify transaction costs?
If funds are efficiently capturing factor premiums, the estimated factor premia from the two-stage regression approach should approximately equal the premiums to the hypothetical research factors (e.g., SMB, HML, MOM, etc.) in a zero transaction cost world. Any spread between realized premia and paper-portfolio premia arguably reflects unobservable transaction costs incurred by live fund managers…in theory…
Here is the idea in more detail: In the first-stage regression, for each fund, regress the net-of-fee returns (excess of RF rate) against the standard factor models (market, SMB, HML, MOM). After this stage, for each fund, one will have the “estimated beta loadings” on each of the factors. Then, in the second stage regression, across all months, regress the net-of-fee returns (excess of RF rate) for all funds against the estimated beta loadings from the first stage for each fund. The “beta estimates” from the second stage regression represent the factor premium earned for each factor for a particular month. Averaging across time, one comes up with the factor premia achieved by all mutual funds over time. These premia estimates are then compared to the paper portfolio returns to the factors, such as the Market, SMB (size), HML (Value) and MOM (Momentum) factors.
What Does the RAFI Paper Find?
Table 2 in the paper shows the following–paper portfolios for the market (Mkt-RF), Size, Value, and Momentum factors earned 8.2%, 2.6%, 3.6%, and 5.7%, respectively. Meanwhile, the real-world mutual fund portfolios earned 4.1%, 3.3%, 2.2%, and 0.4%, respectively! So in real-world portfolios, the premia earned (as measured in the two-stage regressions) is reduced by 4.1% for the market portfolio, 1.4% for the HML portfolio (and is not significant in the real-world) and 5.3% for the MOM portfolio. According to the tests, real-world portfolio managers deliver a lot less of the factor premia than the paper portfolios…and this includes the generic market factor. Weird, to say the least.
The difference between hypothetical and “realized” factor premia is staggering for long-term investors. For example, the compounding of $100 in the paper MOM portfolio increases to $247, while the real-world premia compounds from $100 to only $110! The figures in the paper drive home the author’s point: using two-stage regression premia estimates, real-world portfolios wildly underperform the paper factor portfolios.
After a series of robustness tests, the results are the same–the real-world portfolios deliver lower factor premia than the paper portfolios.
But what is the source of the slippage?
The paper gives two suggestions — (1) trading costs and (2) manager skill. Both can have an effect.
The paper ends with this concluding remark (last paragraph of the paper):(6)
We find that fund managers experience significant shortfalls in their ability to capture factor returns compared to theoretical paper portfolios. In particular, the shortfall is quite strong for the market and value factors, where the return delivered to the end-investor is halved or worse. For the momentum factor the end-investor seems to have enjoyed no benefit whatsoever from fund momentum loadings nor any penalty for funds that have an anti-momentum bias. We suspect the lion’s share of the shortfall is due to trading costs, a topic we may explore in a future article. Factor returns are inherently uncertain, whereas some drivers of slippage, such as costs or returns, which are not captured by the short side of the paper portfolio are a lot more predictable. If these predictable factors are responsible for the slippage, we are likely to see a similar magnitude of slippage in the future.
One thing is clear — using the two-stage regression premia estimation approach, one finds that real-world portfolios deliver lower premia than the paper factor portfolios.
But wait, there’s more…
Following up on the RAFI paper, there is a new working paper by Andrew Patton and Brian Weller, titled, “What You See Is Not What You Get: The Costs of Trading Market Anomalies.” This paper is a more formal academic research paper that builds upon the limited, albeit concise, discussions in the RAFI paper. For example, the RAFI paper attempts to explain why the 4.2 percentage point gap between the realized factor premia and the market factor portfolio is reasonable because of measurement issues, whereas the other factor gaps are not measurement related, but associated with implementation costs. The explanations, while interesting, lack depth. Patton and Weller fix these issues and make it clear that the RAFI paper’s empirical approach tells us little about implementation costs:
[The RAFI paper]…sheds little light on implementation costs because realized factor slopes and factor returns may have very different means…
Here is the full abstract of the Patton and Weller paper (10/31/17 version):
Is there a gap between the profitability of a trading strategy “on paper” and that which can be achieved in practice? We answer this question by developing two new techniques to measure the real-world implementation costs of financial market anomalies. The first method extends Fama-MacBeth regressions to compare the on-paper returns to factor exposures with those achieved by mutual funds. The second method estimates average return differences between stocks and mutual funds matched on risk characteristics. Unlike existing approaches, these techniques deliver estimates of implementation costs without estimating parametric microstructure models from trading data or explicitly specifying factor trading strategies. After accounting for implementation costs, typical mutual funds earn low returns to value and no returns to momentum.
To summarize, the authors come to the same conclusion as RAFI, but via a more rigorous route. Patton and Weller essentially claim that factor investing doesn’t work after transaction costs.
Let’s dig deeper into their results.
The paper examines the returns to both mutual funds and paper portfolios over a longer time period than the RAFI paper (1970-2016).
Below is an image from the paper highlighting the number of mutual funds in the sample each month from 1970-2016.
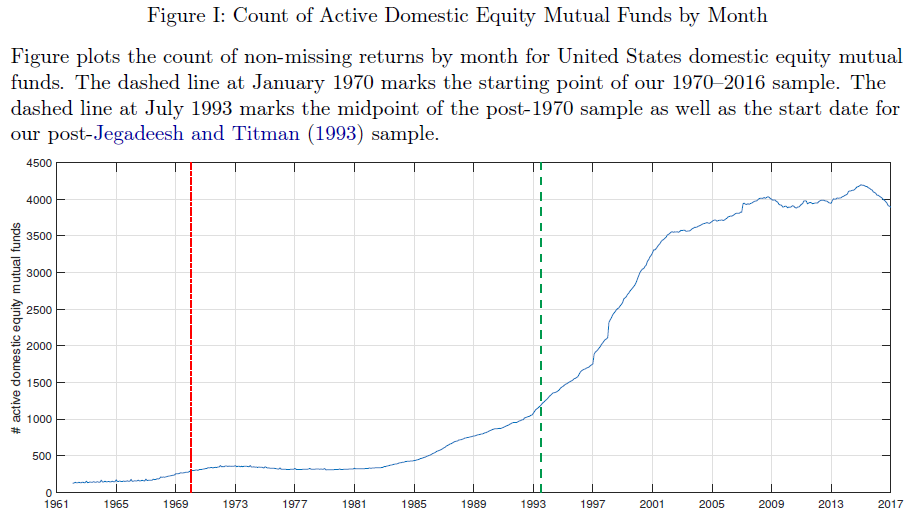
The image above splits the sample into before and after 1993, to account for the Jegadeesh and Titman (1993) momentum finding.
As mentioned above, the paper uses a similar methodology as the RAFI paper, with two-stage regressions. However, the paper adds an additional wrinkle–they compare the second-stage premia estimates of the mutual fund sample to the second-stage premia estimates of “paper portfolios.” This testing environment allows them to compare second-stage premia estimates on live portfolios to second-stage estimates on paper portfolios, thus eliminating the worry that the second-stage premia estimate procedure itself may be driving the results from the RAFI paper. See the appendix for a detailed explanation on this subject.(7)
The paper portfolios examined are mainly from Ken French’s website.
Here is a description of the portfolios from the paper:
Our Fama-MacBeth tests of Section IV combine mutual fund data with common test portfolios. Because our factor set includes value (HML), size (SMB), and momentum (UMD), our baseline analysis uses the Fama-French 25 size-value double-sorted portfolios plus 25 size-beta portfolios, 25 size-prior return portfolios, and 25 size-Amihud illiquidity portfolios to ensure adequate dispersion in loadings to identify risk premia in the cross section. We supplement this set of test assets with an expanded cross section following the recommendation of Lewellen, Nagel, and Shanken (2010). In our larger portfolio set, we also include 49 industry portfolios, 25 size-operating profitability portfolios, 25 size-investment portfolios, 10 beta-sorted portfolios, 10 market capitalization-sorted portfolios, 10 book equity to market equity ratio sorted portfolios, 10 Amihud illiquidity-sorted portfolios, 10 operating profitability-sorted portfolios, and 10 investment-sorted portfolios for a total of 269 portfolios.
In total, the authors examine the returns to either 100 paper portfolios, or 269 paper portfolios, as described above.
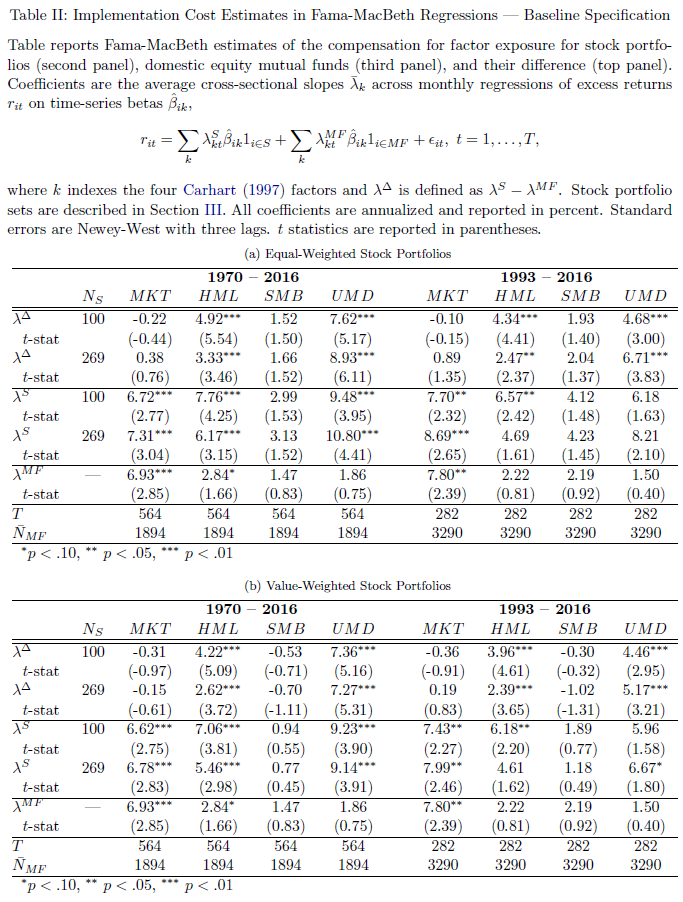
Table II of the paper yields the main result, and is shown below:
The results are hypothetical results and are NOT an indicator of future results and do NOT represent returns that any investor actually attained. Indexes are unmanaged, do not reflect management or trading fees, and one cannot invest directly in an index. Additional information regarding the construction of these results is available upon request.
A quick description of the Table above–Panel A examines equal-weight paper portfolios, while Panel B examines value-weight paper portfolios. Within the panels, the first section examines the difference between the paper portfolios (second section) and the mutual fund sample (third panel). Examining Panel B (VW paper portfolios), we see that over the entire time period (1970-2016), the mutual fund sample delivered a market premium of 6.93%, which is similar to the paper portfolios (6.62% and 6.78%) — the difference between the two is small and statistically insignificant. Now examining the factor investing portfolios, we see that the mutual fund sample’s premia were 2.84% for HML, 1.47% for SMB, and 1.86% for UMD (Momentum), with only Value being marginally significant. Compare this to the paper portfolios, which deliver premia of either 7.06% or 5.46% to HML and 9.23% or 9.14% to UMD which are highly significant (note — SMB is not significant for the paper portfolios). Thus, the difference between the premia for the mutual funds and the paper portfolios for HML and UMD is large and significant–meaning the value and momentum factor premia are not being captured in live mutual funds, compared to paper portfolios.(8)
This analysis is interesting and corroborates the core thesis from the RAFI paper: real-world implementation costs erode the value and momentum factors.
Are the Results Subject to Debate?
Let’s summarize what we’ve covered thus far (a lot of material — congrats on making it this far!):
- Researchers have looked at high-frequency trading data and came to the conclusion that transaction costs matter, but the range of possibilities is huge.
- RAFI presents a new approach to identifying implementation costs and finds that fund managers can’t capture factor premiums
- Patton and Weller conduct a more robust investigation of the RAFI concept and identify that fund managers can’t capture factor premiums.
Should factor investors give up? Not exactly.
The paper covered in the appendix by Ang et al. dives into some statistical issues regarding stocks and portfolios in two-stage regressions. This analysis brings into question many of the findings in the RAFI paper, however, the Patton and Weller paper (“PW” paper) is able to bypass these issues by comparing the premia from paper portfolios to the premia from real-world portfolios.
We dig into the weeds of the Patton and Weller analysis by introducing two realities of the fund marketplace:
- We assume some fund managers are closet-indexing.
- We assume some fund managers shift factor exposures over time.
What happens when we analyze these scenarios? For example, let’s “suspend belief” for a minute and pretend we live in a world where there might be a lot of closet-indexer mutual fund managers who value their careers more than their performance. Moreover, what happens if we assume there are these mythical creatures called, “stock-pickers,” and their real-world portfolios shift factor exposures?(9)
Below, we examine what happens to estimated factor premiums when a hypothetical portfolio manager, 1) closet indexes or 2) “shifts around” their factor exposures over time.
For these tests we examine 175 paper portfolios–these portfolios have no transaction costs at all–purely hypothetical. All portfolios are value-weighted. Specifically, the 175 portfolios are made up of the 25 size and B/M portfolios, the 25 size and momentum (12_2) portfolios, the 25 size and investment portfolios, the 25 size and operating profitability portfolios, the 25 operating profitability and investment portfolios, the 25 B/M and investment portfolios, and the 25 B/M and operating profitability portfolios. These portfolios were chosen to match factor portfolios used within the Fama and French 5-factor model.(10)
The factor returns are taken from Ken French’s website for the following 6 factors: Mkt_Rf, SMB, HML, MOM, CMA, RMW.
Establishing some Baseline Results
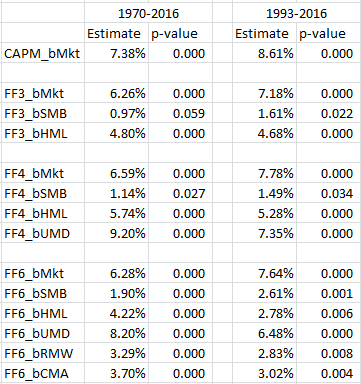
First, we examine the factor premia estimates from the two-step regressions on the 175 paper portfolios. Regression results are shown across two time periods, 1970-2016 and 1993-2016 (similar to the Patton and Weller paper). The results are shown for 4 models commonly used–the market model (CAPM), the 3-factor model, the 4-factor model, and a 6-factor model (FF 5-factor plus momentum).
The results from the second-stage regressions are presented below:
The results are hypothetical results and are NOT an indicator of future results and do NOT represent returns that any investor actually attained. Indexes are unmanaged, do not reflect management or trading fees, and one cannot invest directly in an index. Additional information regarding the construction of these results is available upon request.
As found in the Patton and Weller paper, the paper portfolios achieve highly significant premia, in both time cycles.(11)
What happens if these paper portfolios are able to act more like real-world portfolio managers? Let’s examine what happens to the results when we allow closet-indexing into the sample.
Paper Portfolio Factor Premia with Closet-Indexers — statistical power degrades
One assumption being made in the comparison of real-world mutual funds to paper portfolios is that portfolios managers are taking pure bets on certain factors. What does that mean? Sometimes, a picture can be helpful. Below are images from our visual active share tool, which allows advisors to assess the characteristics or funds and even compare them to academic portfolios. This helps advisors/investors to understand the characteristics of the portfolio, as described here.
The first image below selects the academic high and low 12_2 momentum portfolios. The x-axis displays the percentile ranks of all firms in the universe on the 12_2 momentum characteristic, and the y-axis displays the percentile ranks of all firms on market capitalization. I also highlight 4 of the 25 paper portfolios used in the regressions analysis for illustrative purposes:
- Large, low momentum
- Large, high momentum
- Small(ME2), low momentum(12)
- Small (ME2), high momentum
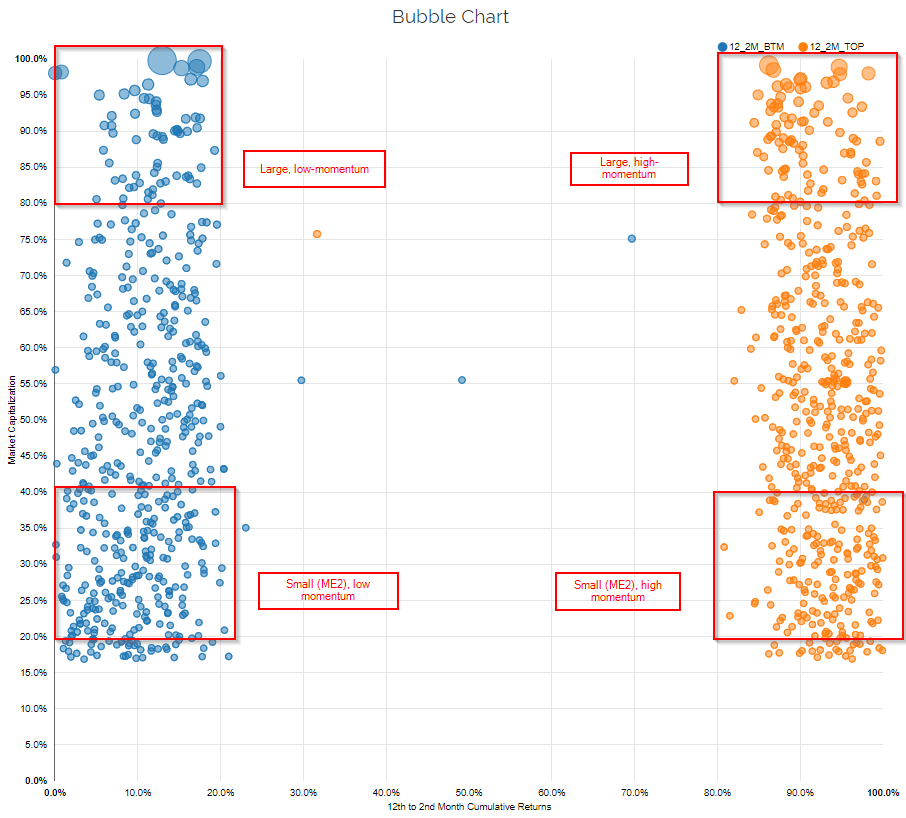
So the above image designates what the factor paper portfolios should look like in practice.
The figure below adds the Vanguard Russell 1000 index (VONE), to highlight where most funds invest.
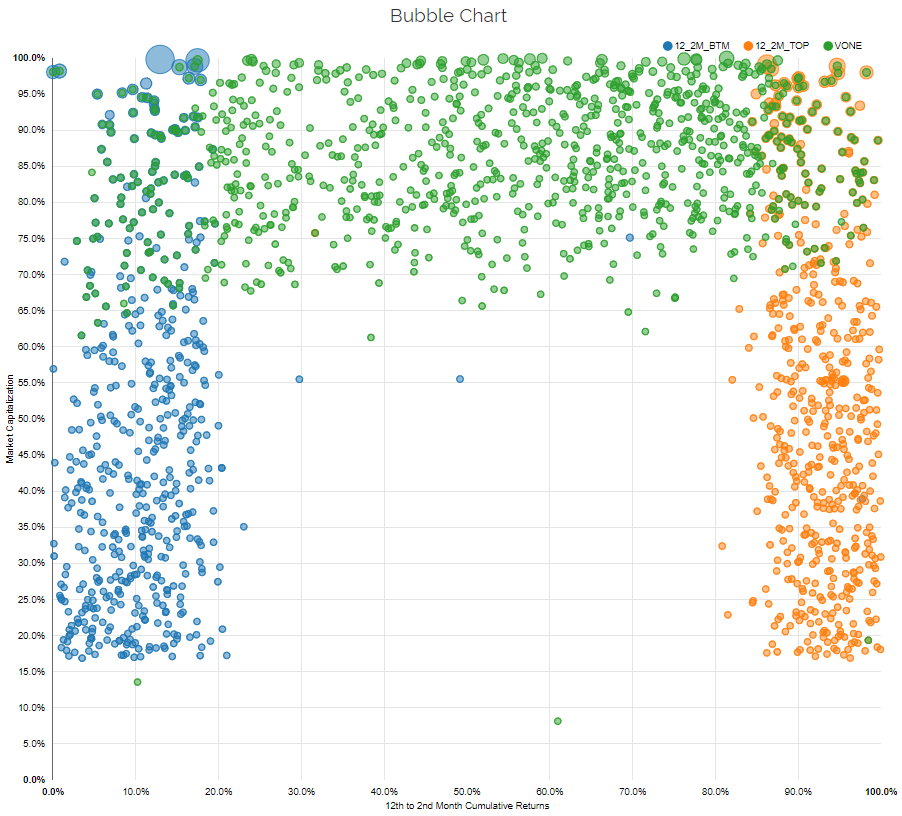
As one can see, the market-cap portfolio does not have a ton of overlap with the large-cap high and low momentum portfolios and has no overlap to the small-cap high and low momentum portfolios (which makes sense).
How do most mutual funds actually invest? Many fund managers maintain a low-tracking error relative to a broad index, meaning that the fund may “tilt” towards a factor, but probably won’t deviate too far from the market-cap weighted passive index portfolio. Some refer to this practice as closet-indexing. Closet-indexing behavior is not necessarily a bad thing (and can be considered a good thing in some cases), and we aren’t trying to create a debate on this subject, we are merely making a point that closet-indexing is a behavior exhibited by many fund managers in the marketplace.
But how does the introduction of closet-indexing potentially affect the results from two-step factor premia estimation procedures? (i.e., the technique used in the RAFI and Patton and Weller papers).
To examine this question we assume that the 175 paper factor portfolios in my tests are “transformed” into closet-indexers. We create this transformation by allowing the 175 paper factor portfolios to invest 80% in the market portfolio, and 20% in the factor portfolio. We then run the same tests from above on these 175 “closet-indexing” factor funds.

What do we find?
Well, the estimated premia are almost exactly the same, which is to be expected. However, interpreting the statistical significance of the results get trickier. The introduction of closet indexing lowers the statistical power of the tests and we notice that there is almost a complete loss of significance for the factor premia. A statistician would argue that the factor premia earned by these portfolios are not reliably different from zero.
What are the implications of this analysis? Well, interpreting the “statistically significance” of a factor premia is more challenging when there is a possibility that portfolios closet index. And by extension, if we relax the assumption that real-world mutual funds aren’t all disciplined factor quants following focused factor portfolios, interpreting “statistically insignificant” factor premia estimates doesn’t necessarily really tell us much about implementation costs.
Paper Portfolio Factor Premia with Factor Shifters — Factor Premia Shrink to Zero
In the analysis above we see that closet-indexing can cause estimates of factor premia to lose statistical significance, mechanically.
Let’s examine another angle on the analysis. What if portfolio managers switch between factors from month to month, i.e they are not 100% following a factor throughout time? And more importantly, how might this affect the interpretation of two-step factor premia estimation results?
We examine this question by simulating 875 paper “factor-switcher” portfolios.(13) To capture the idea of a “factor-switcher,” every month the portfolio manager randomly selects one of the 175 paper portfolio to invest in–this gives the managers the ability to switch their system (factor model) every month (which may represent an ad-hoc stock-picker).
The results of this analysis are shown below:
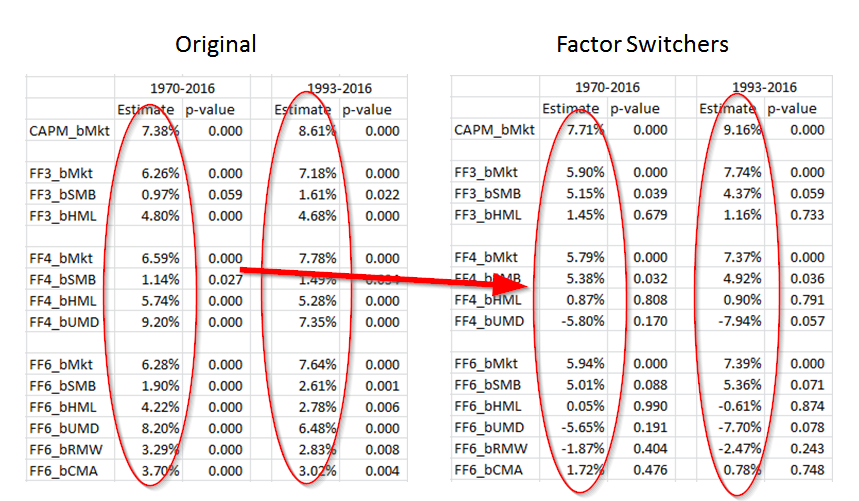
As can be seen above, factor-switching managers earn the small size premium and the market beta premium…and that’s about it. These hypothetical managers have little exposure to the other factors when they are allowed to randomly switch each month.
What are the implications? Once again, under the assumption of ZERO trading costs, factor premia estimates are insignificant when fund managers are able to factor switch over time.(14)
Why does this matter? If real-world portfolios factor shift, two-stage regression premia estimation techniques will low-ball factor premia earned by fund managers. In a factor-switcher world, one cannot interpret the “loss of factor premia” as an implementation cost, because this loss of premia may be observed simply because managers aren’t steely-eyed focused factor quant investors.
Interpreting the Results of Two-Step Factor Premia Estimates is Potentially Hazardous
The Patton and Weller paper is really interesting and we recommend that everyone check it out. These authors take on an immense challenge and do their best with the tools and data they are given. However, the extended analysis conducted above highlights that factor premia estimates from fancy statistical procedures are noisy and can be driven by many elements of the investing landscape that aren’t related to implementation costs. For example, by simply infusing the ideas of 1) closet-indexing and 2) factor-switching, frictionless paper factor portfolios generate negligible two-step factor premia estimates. And by extension, if real-world portfolios exhibit 1) closet-indexing or 2) factor-switch over time, they too will generate near zero factor premia estimates — even if we assume implementation costs are zero!
The reality is that trying to assess trading costs via indirect methods is fraught with challenges that are likely too steep to overcome. We have not even mentioned another realistic possibility–some managers over this time period were simply stock-pickers, not factor investors–these managers would simply add noise to the regressions, causing a difference between the paper portfolios and the real-world portfolios.(15)
The more direct approach associated with the analysis of live high-frequency trading data, although imperfect, is likely to give us better insights into the costs and potential scalability of various investment strategies. Of course, the challenge with this approach is getting access to more proprietary data from different institutional investors. Access to broader datasets would help researchers ascertain whether or not the scalability of factor investing is only accessible to a privileged few, or the broader professional investor landscape.
Summary on factor investing and transaction costs
We’ve highlighted the core research, and our additional analysis, associated with the following question:
Do factor portfolios survive transaction costs?
The key takeaways are as follows:
- Attempting to estimate factor trading costs can be difficult and depends on the data and assumptions employed. Institutional traders, such as AQR and Blackrock, clearly enjoy lower transaction costs than the average investor who buys at the ask and sells at the bid.
- A two-stage regression is a clever way to avoid the mess of delving into high-frequency, and often limited, transaction cost data. However, this methodology is fraught with interpretation issues. For example, one cannot simply compare two-stage factor premia estimates to factor portfolio returns and consider this a “transaction cost” estimate. Mechanically, two-stage factor premia estimates will be lower than factor portfolio returns (see reference 7 for full details)
- Two-stage factor premia estimation studies can be improved, but they face arguably insurmountable interpretation challenges. For example, the introduction of closet-indexing and factor-timing will mechanically degrade factor premia estimates in the face of zero transaction costs.(16)
“Great,” you might say, “what should I believe?”
Here are a few things:
- Trading costs degrade performance.
- Factor investing strategies have capacity constraints.
- Higher turnover factors have lower capacity constraints than lower turnover factors.
- Money doesn’t grow on trees. Excess returns are usually associated with some element of additional “risk.”
Thanks for reading–please let us know if you have any questions.
References[+]
| ↑1 | We believed so strongly in these results that we put our money where our mouth is and launched an entire business on the concept. |
|---|---|
| ↑2 | MTUM is almost there. |
| ↑3 | We may not get there, but we’ll put in a good faith effort. |
| ↑4 | Here are some reference materials on this database. |
| ↑5 | It should also be pointed out that the capacity of a strategy does not happen in a vacuum. For example, the capacity of long-only momentum strategy may be higher than people realize, because there may be large organic flows counteracting flows into stocks with momentum characteristics. An interesting paper by David Blitz, highlighted here, shows that in total, factor ETFs invest in the market–meaning that while there are many ETFs investing in different factors, on net, they have no loading to the factors (value, momentum, etc.). The chart below is specific to Blitz’s results on momentum factor loadings: 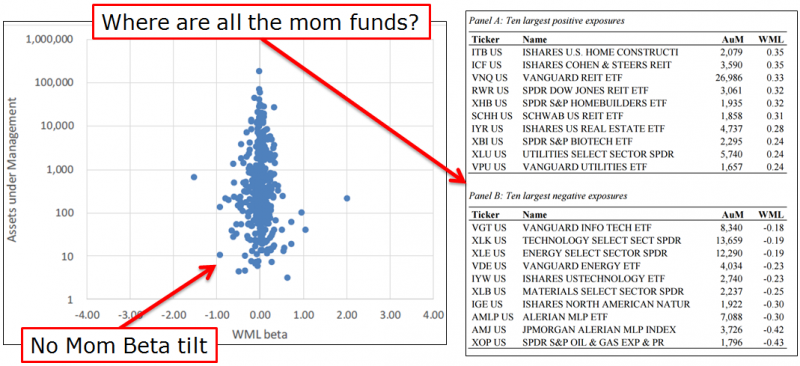 Few interesting takeaways: Few interesting takeaways:
|
| ↑6 | I do not like taking quotes out of context, but I believe this is representative of the story put forth in the paper. However, I recommend everyone read the full paper |
| ↑7 |
Inside the Black Box of Two-Stage RegressionsOne assumption made in the RAFI paper is that one can compare the estimated premia from two-stage regressions and compare these results to the premia earned by the L/S factor portfolio (HML, SMB, MOM, Mkt_Rf). However, as very aptly pointed out here by Corey Hoffstein, there are known mathematical issues with using a two-stage regression approach. It should be noted, this was accurately mentioned as an issue in the RAFI paper. In an attempt to explore Corey’s discussion, I stumbled across a 10-year old working paper (yes, that is correct, 10 years). The paper is titled, “Using Stocks or Portfolios in Tests of Factor Models,” by Andrew Ang, Jun Liu, and Krista Schwarz. A version of the newest paper can be found here and the 10-year old version can be found here. Before digging into the details, here is the abstract of the Ang et al. paper:
To summarize in English: estimates of risk premia from two-stage regressions are equivalent to analyzing Shaq’s shots on a three-point contest. Noisy…at best. A little background — one way to test an asset pricing model is to use the Fama Macbeth (two-stage) regression. Examining the 1992 Fama and French paper, they examine the Fama MacBeth regression results and conclude that including Size and Value helps to better explain the cross-section of stock returns. So 2-stage regressions are somewhat common as a way to examine asset pricing models. Now an assumption in many (almost all) empirical asset pricing papers is that forming portfolios of stocks (as opposed to using individual stocks) is an acceptable and appropriate method. The big idea (highlighted in the Ang et al.) is that by forming portfolios, the estimates of beta will be more efficient (Blume 1970). Note: There is a neat discussion within this paper how Fama and French 1992 use all stocks but computes betas using test portfolios. However, using portfolios (as opposed to stocks) has a potential downside, which is exacerbated when running a two-stage regression. From the paper:
So what does that mean? High-level, creating portfolios destroys cross-sectional information, and doing so creates larger standard errors of the risk premia (the second stage loadings). The paper measures efficiency losses by examining variance ratios between portfolios and using all stocks, as below:
The results using Monte Carlo simulations are found in Table two of the paper, and shown below: 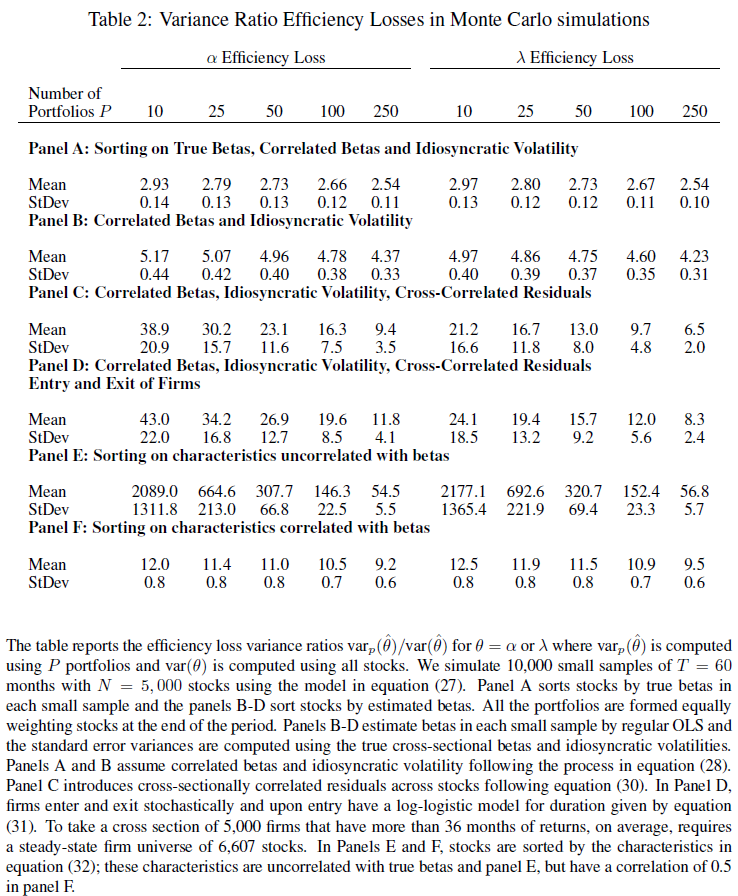 But what do the above numbers mean? These numbers show the ratios of the variance of the alpha and lambda (for portfolios) divided by the variance of the alpha and lambda (for all stocks) from the Monte Carlo simulations. (For full details, please review the paper.) In Panel A, when forming portfolios based on the true Betas, the Table above highlights that for 10 portfolios, the variance ratio is almost 3 times as large for the lambda. Going out to 250 stocks, we see that the ratio is still above 2.5. Panels E and F sort stocks into portfolios using a characteristic (such as size — formally this is equation 32 of the paper). What one finds is that even after accounting for the correlation of the characteristic with the betas, and having 250 portfolios, the variance of lambda is around 10 (9.5) times as large as the variance using individual stocks. So in total, using portfolios (even out to 250) causes a much higher variance of the lambda (2nd-stage) estimators. But what about real data, not Monte Carlo simulations? In other words, how does this affect stock portfolios? The paper examines this by running the two-stage regressions, of either (1) individual stocks or (2) portfolios against the market model. To form portfolios, the paper uses 5-year estimates of betas for every stock, and then assigns them to portfolios. Stocks are kept in the portfolios for 1-year, and this process is repeated every year. So for example, if there are 5 (10) portfolios, this contains stocks, sorted by beta, into quintiles (deciles) — this process is applied out to 50 portfolios in Table 3 of the paper, and out to all stocks in Figure 3. First, we examine Table 3 (below) which sorts stocks into either 5, 10, 25, or 50 portfolios. 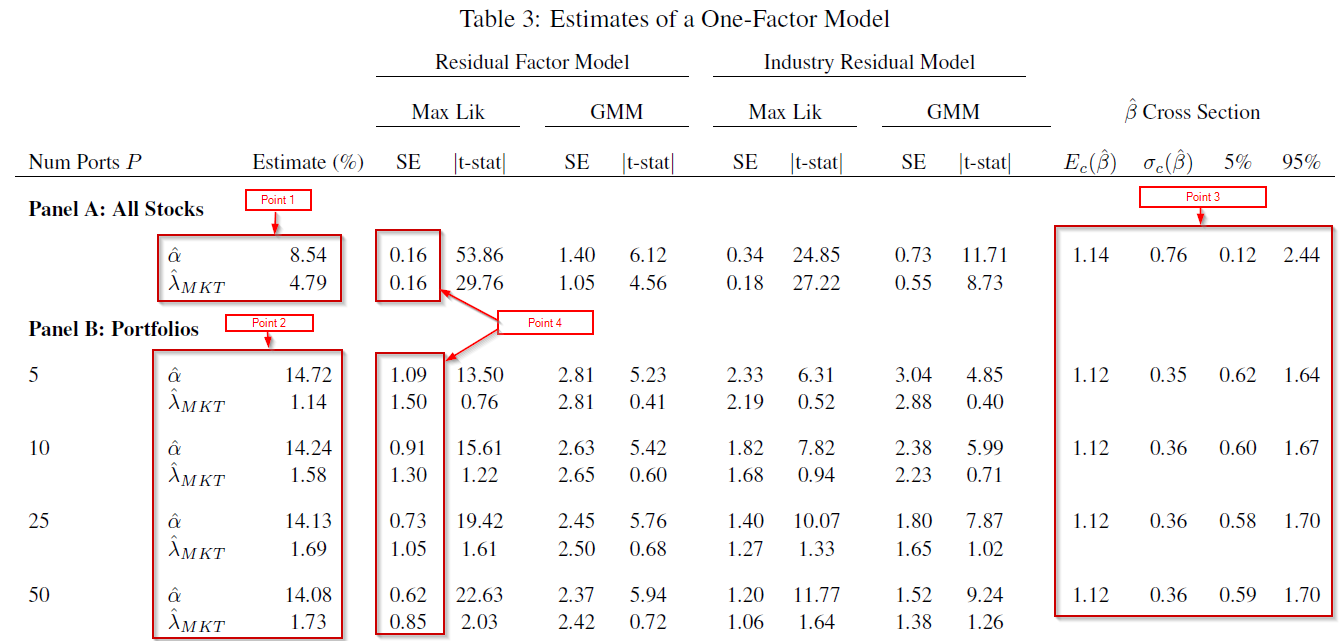 Examining the results to Table 3, there are a few things worth noting (follow the 4 points below with the Table above):
But what happens if we allow the portfolios to include fewer stocks (thereby increasing the number of portfolios)? This is shown in Figure 3 of the paper, and is shown below: 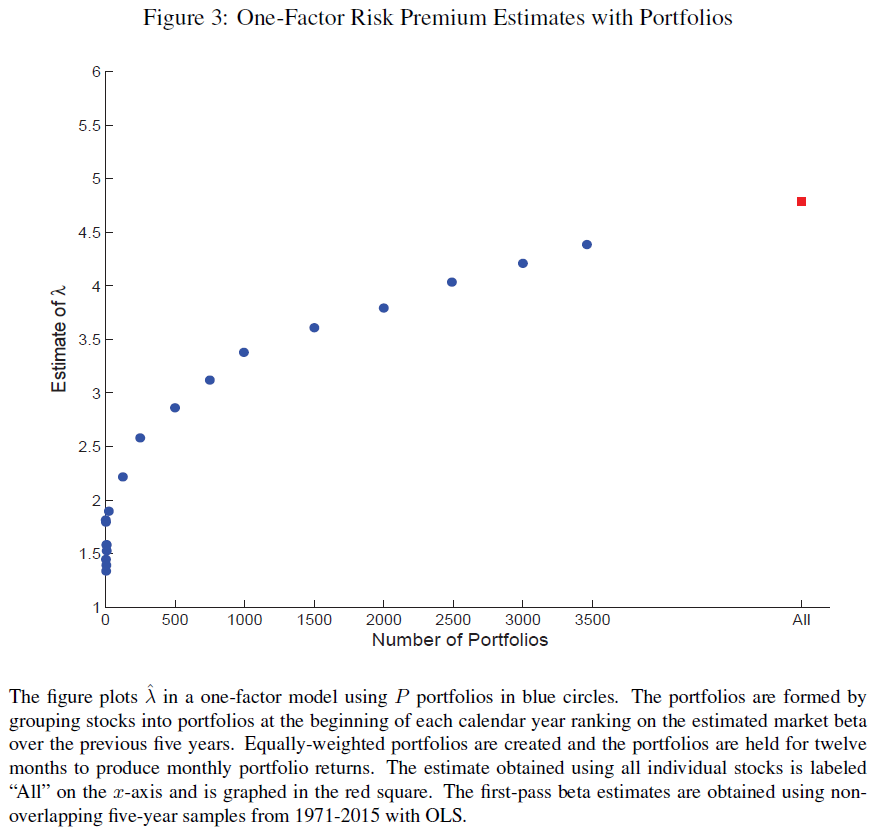 What one notices above is that as the number of stocks in the portfolios decreases (and the number of portfolios increases), the estimate of lambda (market premia) increases. However, even at 3500 portfolios, this is still below the lambda estimate using all stocks (around 4.5%), and still well below the market risk-premium over the same time-period of 6.43%. Two points to emphasize here:
But what happens when we examine factor models, such as the Fama and French 3-factor model? The paper examines this by once again either using all stocks or forming portfolios. For the portfolios, these are n x n x n portfolios, formed first by sorting on the market beta, then the size beta, then the value beta. The paper examines 8 (2 x 2 x 2) or 27 portfolios (3 x 3 x 3). The first-stage regression coefficients are shown in Figure 5 below: 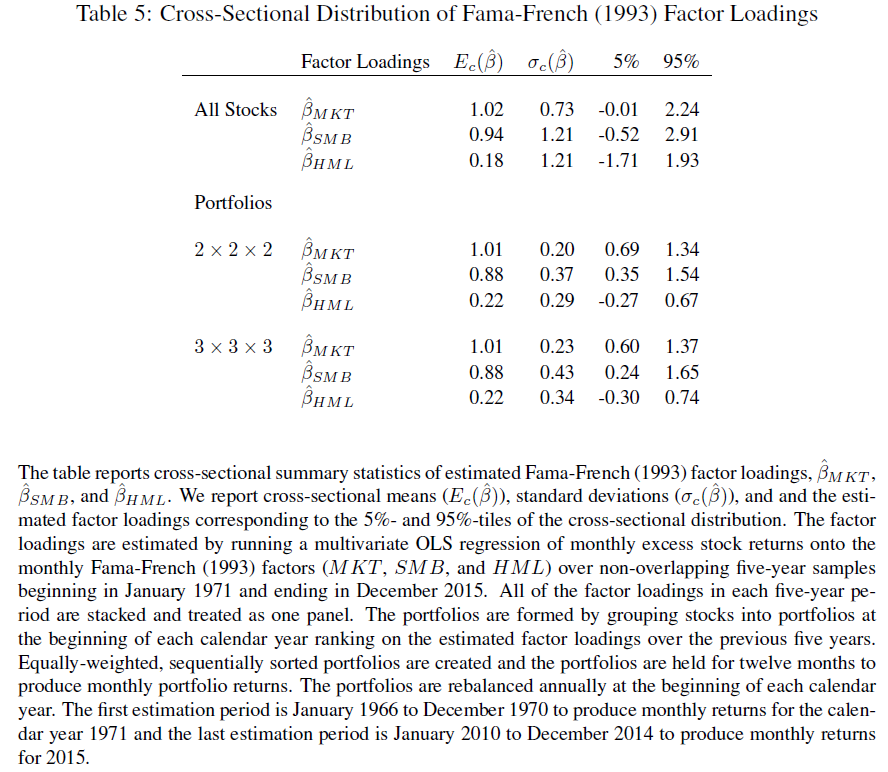 Once again, we notice a similar pattern when using the market model–the beta loadings are similar when using all stocks or portfolios; however, the distribution and standard deviation differ. Table 6 shows the 2nd-stage estimates, showing once again there are larger errors for the portfolios lambdas compared to all stocks (magnitude is around 20 times+!). A big note — the paper by Patton and Weller (and I believe the RAFI paper) does not allow for an intercept, while this paper does. This can have an effect on the 2nd-stage loadings. However, how do the 2nd-stage estimates compare to the premia earned by investing in the factor portfolios, Mkt_Rf, SMB, and HML? Table 7 of the paper examines this and is shown below.  As can be seen above at the top of Table 7, the mean factor premia are 6.43% for the market, 2.16% for SMB, and 3.90% for HML over this time period (i.e. the average return to the Mkt_Rf, SMB, and HML portfolios from Ken French’s website). Panel A shows the lambdas (premia estimates) for the market (5.05%), size (6.79%) and value (0.01%) when using all stocks. When using portfolios, the market premia turns negative (-5.54% or -4.87%), size becomes large (11.50%), and value is small (0.8% or 1.64%). As mentioned above in a reference, the Patton and Weller paper does not allow for an intercept in the 2nd stage, whereby the alphas in this paper are 2.43% for all stocks, 11.01% for the 2 x 2 x 2 portfolios, and 10.51% for the 3 x 3 x 3 portfolios–eliminating the alphas can have an effect on the 2nd-stage estimates (these numbers are from Table 6 of the paper). Using either all stocks or portfolios yields different premia results — the market premia turns from positive (and close to the mean factor return) using all stocks, to negative when using portfolios. So should we expect the risk premia to be equal to the mean factor return portfolio (i.e. from Ken French’s website)? According to the paper, no.
Important to this conversation–this paper shows the factor risk premia does not equal the mean factor return, and that is with assuming transaction costs are zero! If we added in transaction costs, this would reduce the factor risk premia compared to the mean factor return (the paper portfolio from Ken French’s website). So big picture is the following:
Next, we move onto the bunk assumption made in the referenced papers that real-world portfolios are factor portfolios. |
| ↑8 | The paper does additional analysis to account for liquidity and finds the same results — mutual funds deliver less value and momentum premia when compared to the paper portfolios. Additionally, the paper matches individuals stocks to mutual funds along characteristics (through betas), and again finds a difference between the mutual fund sample and the paper portfolios. |
| ↑9 | This is tongue in cheek if you hadn’t guessed. |
| ↑10 | We also add momentum portfolios, despite Fama and French’s best attempts to avoid the discussion in the context of their 5-factor model. |
| ↑11 | One nuanced detail from the paper, and done above, is to eliminate an intercept. The reason is given in the PW paper:
To highlight what happens if we eliminate this assumption, I ran the same regressions, but dropped this restriction on the second-stage, allowing for an intercept. The results are shown below: 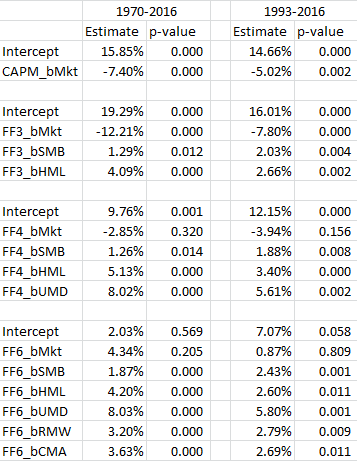 The results are hypothetical results and are NOT an indicator of future results and do NOT represent returns that any investor actually attained. Indexes are unmanaged, do not reflect management or trading fees, and one cannot invest directly in an index. Additional information regarding the construction of these results is available upon request. As can be seen, the intercept is generally positive and significant, while the market is negative and significant (except for the 6-factor model). This result falls in line with the Ang et al. paper which has negative market loadings, with significantly positive intercepts. However, the factor loadings barely change and have similar significance. So in either case, using an intercept or not, these paper portfolios deliver positive factor premia, while the PW paper shows the real-world mutual funds do not. |
| ↑12 | Note our visual active share tool eliminates the bottom 20th percentile of stocks, so I am showing the 2nd smallest quintile of stocks |
| ↑13 | We chose 875 at random, but the results hold for 1000, 10,000, or any other large number of simulations |
| ↑14 | A note on the SMB exposure–by definition, the returns to the Mkt_RF factor (aka Beta) are generally driven by mega-cap firms (the top 20% of firms on market cap). So when running regressions and including 80 portfolios that are formed by including stocks below the 80th percentile, the data-set implicitly has a small-cap bias.Of the 175 portfolios, 100 are formed by splitting no market cap and then another factor (value, momentum, profitability, investment). Of these 100 portfolios, only 20 are in the mega-cap universe (80th percentile and above for market cap). |
| ↑15 | Here is another example:
When first working on this project, we wanted to see how the “best” long-only factor portfolios would perform, as this is how most factor funds are run, by tilting towards the key factors via a long-only portfolio. To do this, I examined a subset of the 175 paper portfolios. Specifically, I began by examining the 25 portfolios formed on a combination of (1) size and (2) either value, momentum, profitability or investment. Within each double sort, I kept all market-cap sizes, and the top two quintiles on each factor (value, momentum, profitability, or investment). So for value and size, this gave me 10 portfolios, the same for the other 3 factors. In total, I have 40 portfolios. These are selecting (within each size bucket) the top two quintiles on the 4 factors, and are sticking to the model (not changing as in the last section) and are not closet-indexing (as in the 1st section). Note: I excluded the portfolios that had double sorts of factors, other than size, in an attempt to keep the study simple and related to the individual factors. If we are going to find a positive factor premia, these portfolios would be ideal candidates. The results of the 2-stage regressions are shown below for my 40 portfolios: 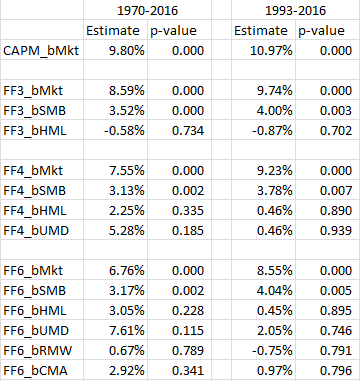 As can be seen above, there is little significance for the factors, save size. Once again, the dataset is biased towards small-cap stocks, relative to the market-cap weighted portfolio. So, to the extent we compare the results to mutual funds (which are long-only) to paper portfolios, which are inevitably long and short (due to high and low rankings on a particular factor), we should account for this result. The PW paper compares quintile 4 and 5 stocks to mutual funds in Table 5 of their paper, by matching on risk-loadings (i.e. regression Betas on the factors). This would be akin to comparing the portfolios above to MFs matched as described in their paper. However, as we know, and have seen above, if we assume MFs either (1) closet index or (2) change their factor from time to time, one should expect a difference, which they find in the paper. Note that their significance on the VW portfolios matched on one factor almost drops completely, hinting a size effect may be at play in the paper portfolios. Quick digression–there is a decent strand of research that suggests matching mutual funds on characteristics, and not fund loadings as done in the PW paper, is more appropriate for measuring future returns of mutual funds. For an overview of this discussion, read our article here. This literature starts with the Daniel et al. 1997 paper, “Measuring Mutal Fund Performance with Characteristic-Based Benchmarks.” This paper creates the methodology that future papers build upon to assess mutual funds using characteristics. A follow-up paper, “On Mutual Funds Investment Styles” by Chan, Chen, and Lakonishok (2002) directly tests which method is better, characteristics or loadings. From the abstract, “Though a fund’s factor loadings and its portfolio characteristics generally yield similar conclusions about its style, an approach using portfolios characteristics predicts fund returns better.” Here is a nice summary of the results from the paper:
In addition, Table 6 of the paper examines the difference between the actual and predicted returns in situations which no one would expect would ever occur — for funds that are classified as growth using factor loadings but are classified as value using characteristics (or vice versa)!! Thus, in reality, factor loadings may predict a fund to be a growth fund when in fact it is a value fund using characteristics! In such a case, the paper finds (in Table 9) that characteristics are a better predictor of returns–for growth funds (on characteristics) that are value funds (on loadings, as in the PW paper), the mean monthly error between real and predicted is 0.16% on characteristics, and 1.07% on loadings. An additional paper by Chan, Dimmock and Lakonishok (2009), “Benchmarking Money Manager Performance: Issues and Evidence” find large deviations when comparing real and predicted returns by matching on either characteristics or loadings. From the conclusion of the paper:
Thus, there is a large deviation and range when using characteristics or loadings-based methodologies. The evidence is generally in favor of using characteristics (not loadings) to match mutual fund performance to predicted performance. Last, I recommend users use our tool to find ETFs that match the paper portfolios (start typing in “academic” in the search tool)–one will quickly find that very few (if any) ETFs truly follow the paper portfolios as shown (again) below. If anyone finds an ETF that invests very closely to small-cap high-momentum stocks (similar to the paper portfolio that they will be compared against in 2-stage regressions), please let me know!! But back to the regression analysis–next, I ran the same regressions, but ranking on the bottom two quintiles on each of the 4 additional factors (value, momentum, profitability, or investment), while allowing size to vary from quintile 1 -5, as before. The result is that we have 40 portfolios. The results of the regressions are shown below: 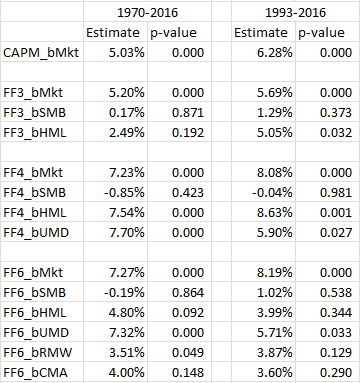 The results are hypothetical results and are NOT an indicator of future results and do NOT represent returns that any investor actually attained. Indexes are unmanaged, do not reflect management or trading fees, and one cannot invest directly in an index. Additional information regarding the construction of these results is available upon request. As can be seen, compared to the long portfolios, the short portfolios now produce positive and significant factor premia. Last, I run the returns on Long and Short paper portfolios, for a total sample of 80 observations each month. The results are below:  The results are hypothetical results and are NOT an indicator of future results and do NOT represent returns that any investor actually attained. Indexes are unmanaged, do not reflect management or trading fees, and one cannot invest directly in an index. Additional information regarding the construction of these results is available upon request. Here, we find positive and significant premia on almost every factor, in both time periods. So when examining the long-only, short-only, and long-short portfolios (included in the two-stage regressions), we generally find the most significance when including both long and short portfolios. To the extent a sample of MFs is long-biased, this result (on the paper portfolios) needs to be acknowledged. |
| ↑16 | There may be less factor timing/switching nowadays with more “factor” portfolios, however that was not necessarily the case in the past |
 and
and 
 ) for all stocks, one notices the premium is 4.79% (Panel A). This is similar, but not the same, as the true equity market premium (over risk-free rate) of 6.43%. Thus, even when using all stocks, one does not fully achieve the full equity market premium (or excess market return).
 ) from the first-stage regression, we notice a few two things. First, is that the average Beta is similar across all stocks and the portfolios–this number is around 1.12. Second, the standard deviation and distribution for all stocks is both larger (standard deviation) and wider (distribution when examining the 5% and 95% cutoffs). This gets back to the original issue–using portfolios causes a loss of information, whereby we see that using all stocks, there is a higher standard deviation and wider distributions of beta estimates.
 is not otherwise well identified in our stock portfolio sample, namely the time series of the intercept
  and the estimated market risk premium
  are strongly negatively correlated and of similar magnitudes.
About the Author: Jack Vogel, PhD
—
Important Disclosures
For informational and educational purposes only and should not be construed as specific investment, accounting, legal, or tax advice. Certain information is deemed to be reliable, but its accuracy and completeness cannot be guaranteed. Third party information may become outdated or otherwise superseded without notice. Neither the Securities and Exchange Commission (SEC) nor any other federal or state agency has approved, determined the accuracy, or confirmed the adequacy of this article.
The views and opinions expressed herein are those of the author and do not necessarily reflect the views of Alpha Architect, its affiliates or its employees. Our full disclosures are available here. Definitions of common statistics used in our analysis are available here (towards the bottom).
Join thousands of other readers and subscribe to our blog.