In this article, we discuss the state of the ETF industry, the characteristics that ETF providers typically have, the major ETF platforms, mergers and acquisitions, and more.
An overview of the ETF Industry
In 2017, I wrote the following passage about the state of the ETF industry:
In 2014 and 2015 there was a wave of ETF company acquisitions by large asset management firms. The reason was simple: if an asset management company was not in the ETF game, they realized they really needed to get in it. ETFs were not a fad that was going away. Asset management firms had two options: 1) build the ETF division of their firm from within, or 2) acquire an ETF company and its existing team and/or ETF products.IndexIQ was acquired by New York Life. Janus bought VelocityShares. Oppenheimer Funds bought RevenueShares (full disclosure: my former employers). Hartford Funds acquired Lattice Strategies. Columbia Threadneedle bought Emerging Global Advisors.
For most of the history of ETFs, ETF firms were taking assets from competing industries (hedge funds, mutual funds, and futures). ETF firms weren’t really in competition with each other as there were relatively few ETF companies and overall assets of the ETF industry were relatively small compared to all investable assets. It was much better going after the larger pie of assets in (or flowing to) the mutual fund and hedge fund industries.
The prior year for the US ETF industry’s mergers and acquisition activity showed that is changing. Regardless of whether asset management firms acquired their way into the business, or launched their own product suite, the goal of M&A is different. The ETF industry has now grown to the point that ETF firms are no longer only competing against those other industries for assets. ETF firms are now competing against each other as well.
The strategic question firms are asking themselves has changed from, “How do we enter ETFs?” to, “How do we grow our ETF business and/or protect what we have?”
Some examples of this include:
- Wisdomtree acquired ETFS’ European business and Junxure CRM (through FutureAdvisor) to diversify the asset classes represented by their products, expand globally, and increase their fintech capabilities.
- Invesco PowerShares acquired Guggenheim’s ETF business (both companies together are less fragile than separate as it reduces their overall AUM concentration).
- Franklin Templeton launched a suite of low-cost ETFs to use their distribution platform to enter the low-cost battle. (Not many assets thus far!)
- Mirae Investments acquired Global X.
- CICC acquired KraneShares, to establish a US presence.
- Van Eck acquired Think ETFs, a Dutch ETF issuer, to increase its global presence.
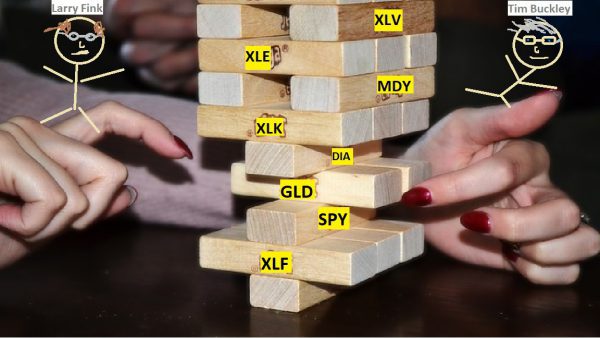
Who is next up on the ETF M&A Chopping Block?
In this post, I’m looking at the ways we can classify ETF firms (in order to gain some insight on merger and acquisition activity) and what firms may be most likely to be involved in future M&A activity. This can give us insight into what stage of development the industry is at and where we are heading.
ETF Firm Qualitative and Quantitative Characteristics
In baseball, there are two schools of thought for evaluating players:
- The eye test
- The Moneyball approach
To the old school baseball types, the eye test is the way to go. The eye test involves things like grit and hustle that the statistics can’t pick up. To the new school statisticians, the numbers don’t lie. Either the player has a higher WAR (Wins against replacement) or he doesn’t. Being a good “clubhouse leader” and always running out first base be damned!
For me, I’m often running the eye test on firms in the ETF industry. Looking at the industry in 2011, I saw that almost all ETFs were market cap weighted. However, a few firms were doing something slightly different. These innovators were taking the larger indexes, e.g., S&P 500, and weighing them by alternative weighting schemes (earnings, dividends, revenues, etc). My initial reaction to these emerging “smart beta” strategies was positive: the advantages of the ETF structure plus an alternative weighting scheme was a step forward in the industry. That hunch led me to leave the NYSE’s ETF desk and join the team at RevenueShares. My timing was great — two years after arriving at RevenueShares our AUM grew from $450 million in AUM to $1.1 billion and eventually led to a successful sale of the business to the mutual fund giant, Oppenheimer Funds.
During my time at RevenueShares, I met Wes at the 2014 MorningStar ETF conference. Wes talked about the academic research on factor investing. Previous to my discussion with Wes, I was not aware of the academic research behind the so-called smart-beta strategies that were being pitched. As a practitioner, I knew the ETF structure was superior on many angles (cost, transparency, and taxes). And I knew (or thought I knew) that it didn’t seem to make sense to own stocks by ranking them from largest market cap to the smallest. But to invest in a concentrated amount of stocks based on factor research (which Wes discussed) seemed like a large leap. To me, there was something intuitive about this approach. If we believe in a certain investing factor, we should own the factor and not dilute the factor via the closet-indexing constructs that existed in smart-beta strategies. Or to invert that, if we believe that some stocks have certain characteristics that make them unlikely to produce good returns going forward (they’re expensive or other negative characteristics), why would we want to own those stocks at all — even if the allocated weights are small? So now the equation was ETF structure + different investing strategies based on academic research + concentration? Yeah, sign me up! That realization led me to join Alpha Architect, which (on the ETF side) has grown from about $183 million in AUM to over $450 million in 12 months.
And for similar eyeball test type qualities, it led me to name three firms, which I believed would make good acquisitions (at the time) because they would continue to grow quickly: Cambria Funds, Pacer ETFs, and O’Shares. While none of the three firms I mentioned were deemed “the most acquirable” in my article last year, these firms have grown quickly via innovative product offerings and unique marketing approaches.
- Cambria grew from $383 million to $757 million in AUM,
- Pacer grew from $833 million to $1.8 billion in AUM, and
- O’Shares went from $446 million to $687 million in AUM (if you combined both the FQF trust and their recently launched OSI ETF Trust).
Pacer and Cambria are quite a bit pricier of an acquisition now(1) (2)
I’ll call myself 75% right here.
I do not think I’m unique in these predictions. It didn’t take a genius to look at Bryce Harper in his rookie year and predict he was going to do well going forward. Similarly, many of you could’ve made good estimates and guesses on who is going to do well in the ETF industry.
But gathering quantitative insights on the sports industry has uncovered new ways of looking at individual players and teams. My goal is to share with you some of the qualitative characteristics of firms (that I believe shapes a lot of what they do), and now attempt to quantify some of that as well. In doing so, we create analysis that may have predictive insights on what ETF firms do from a business standpoint, help investors understand why firms offer the types of products they do, what product types they’re likely to roll out in the future, and may help job-seekers who want to break into the ETF business (or leave the one they’re at!).
For our eye test, I’ve broken all ETF firms above $1 billion in AUM into divisions to categorize firms. Last year, I categorized all ETF firms above $1 billion to show why they weren’t really acquirable. This year, with the industry beginning to compete against each other, my goal is to categorize similar ETF firms together to give us a better feel for what motivates the different firms. For example, if you’re a stand-alone ETF company you need to grow and protect that business at all costs because that’s all you have. However, if you’re part of a larger company you might have different motivations.
And for our quantitative approach, I’ve analyzed all ETF firms’ product sets based on a normalized Hirschmann Herfindahl Index (HHI) score. The normalized HHI score (typically used to measure industry concentration) will give us color on what firms are robust and what firms are fragile. We’ll talk more about the normalized HHI score further down, but we’ll start with the fun part.
The Industry’s ETF Providers, by Category
Here’s our version of the National ETF League (NETFL), as per the 2018 ETF League Tables. (3)(4)
The “Oligarchy, but we all want to be Monarchy” Division
- BlackRock – $1.38 Trillion
- Vanguard – $870 Billion
- State Street – $609 Billion
- Invesco Powershares + Guggenheim – $177 Billion
- Charles Schwab – $107 Billion
The “Strong, Independent, We Don’t Need No Help” Division
- First Trust – $63 Billion
- WisdomTree – $44 Billion
- Van Eck – $36 Billion
- Pacer Financial – $2.1 Billion
- ARK – $1.5 Billion
The “Owned by a Bigger Firm” Division(5)
- PIMCO – $16 Billion (Allianz)
- Global X – $10 Billion (Mirae Asset)
- IndexIQ – $4.2 Billion (New York Life)
- Oppenheimer Funds – $2.5 Billion (Mass Mutual)
The “Ice Cube” Division (For Old School Firms Reinventing For the New School)
- Northern Trust – $17 Billion
- Fidelity – $10 Billion
- Goldman Sachs – $7 Billion
- JPMorgan – $7 Billion
- The Principal Financial Group – $3 Billion
- Victory Capital Management – $2.6 Billion
- Franklin Templeton – $1.2 Billion
- John Hancock – $1.1 Billion
- Virtus – $1 Billion
The “Las Vegas” Division (for firms that are mainly built on leveraged products)
- Proshares – $30 Billion
- Direxion -$13 Billion
The Concentrated “I’m Not Fat, I’m Top Heavy” Division (for firms that have more than 50% of assets in one ETF)(6)
- ALPS – $14 Billion (69% in AMLP)
- Deutsche Bank – $13 Billion (52% in DBEF)
- US Commodity Funds – $3.4 Billion (60% in USO)
- KraneShares – $2.1 Billion (78% in KWEB)
- Columbia – $1.2 Billion (68% in ECON)
- Virtus – $1 Billion (56% in AMZA)(7)
The Mean Girls “You Can’t Sit With Us” ETNs Division (Because, you can’t sit with us, ETNs)
- UBS – $7 Billion
- Barclays Bank – $7 Billion
- Credit Suisse – $4 Billion
The Exemptive Relief Division (For firms who are mainly based on being a white label issuer)
- Exchange Traded Concepts -$5 Billion
- ETF Manager’s Group – $2.5 Billion
- AdvisorShares – $1.1 Billion
The “WisdomTree bought all our assets and now we don’t know what we are doing” Division
- ETF Securities (US) – $2.8 Billion (Under contract according to Eric Balchunas)
Going down the divisions this year, there are two divisions that seem to make the most sense as merger or acquisition targets:
- The Concentrated “I’m Not Fat, I’m Top Heavy” Division: for firms that have more than 50% of assets in one ETF
- These names are interesting for two reasons. The first reason is it makes sense for them to look to merge with a similarly sized firm to reduce the concentration of their assets. Second, due to their concentrated assets, they can be a clean add-on to another asset manager looking to expand into whatever asset class/ETF type their assets are concentrated in. I give some more concrete examples below.
- The “Strong, Independent, We Don’t Need No Help” Division
- These independent firms are clean acquisitions and range in size from small to large asset managers, making them very interesting acquisition targets for all sorts of asset managers.
With that qualitative look, let’s turn to a more quantitative look to see if that tells us anything additional.
ETF Firms Quantitatively Measured
Now let’s look at the concentration of ETF Firms’ assets. The Herfindahl–Hirschman Index Score (HHI) is typically used to measure the concentration of firms across industries. It can be used by regulators to attempt to quantitatively measure if an industry is a monopoly, perfect competition, or something in between.
Instead of measuring the concentration of firms within the ETF industry, I applied the measure to calculate the concentration of each firms’ assets. Each fund within a firm is measured as a stand-alone company. This can give us an idea of which firms are currently the most robust firms (low concentration of assets) to what ETF firms are the most fragile (high concentration of assets).
From Wikipedia, here’s the formula (skip this part if you just want the summary):
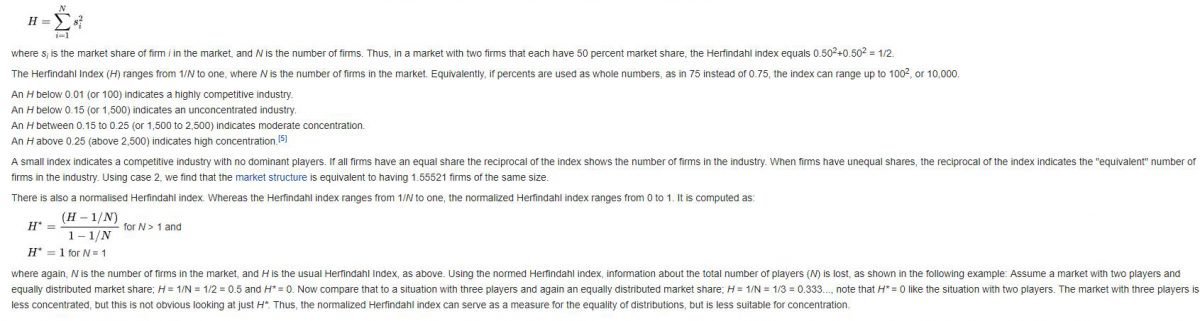
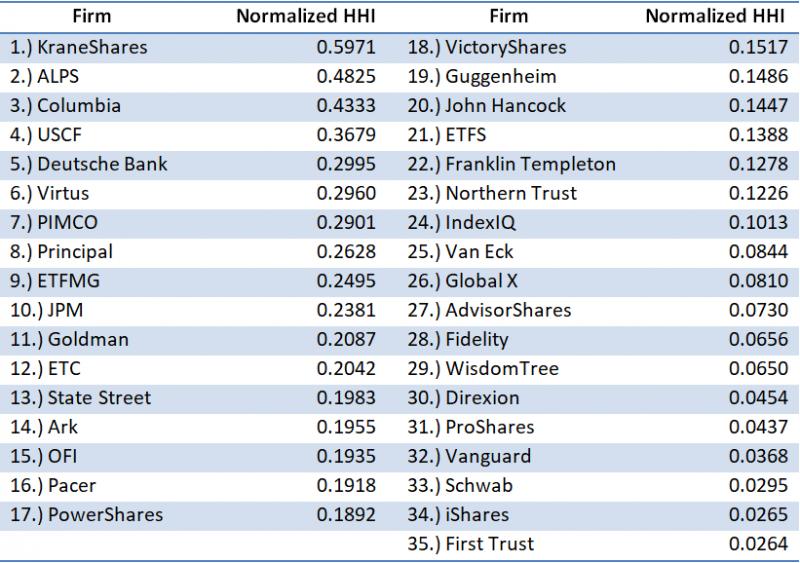
And here are the results for all ETF firms that manage $1 billion or more in AUM as of 3/01/2013, in order of most concentrated assets to least concentrated assets:
Potential Mergers and Acquisitions in the ETF Space
Looking at the bottom of the list/most robust firms in the industry, we can see many of the industry’s largest firms are there: First Trust, iShares, Vanguard, and Schwab. None of them are reliant on a single fund or handful of funds for the majority of their AUM. This makes them more robust. All of these firms are in the top five of assets under management. There’s one major firm missing though: State Street. State Street comes in at number 13 overall making them one of the more fragile firms in the business.
Their AUM has them as the third largest ETF issuer. But with approximately 43% of their AUM in one fund (SPY) they are more fragile than they initially appear. With iShares (IVV) and Vanguard (VOO) doing their best to whittle away at SPY’s dominance, it could be a good time for them to look around and put some of the cash flow from SPY to work.
It’s not a dire situation, but State Street could use these HHI scores combined with the firms on the Independent and Concentrated divisions(8) above to see who could best help them reduce their fragility. For example, they could acquire USCF to increase their commodities exposure, and move them down the fragility list. Or they could take a look at Pacer, to add Pacer’s lineup of trend-following ETFs, to assist in lowering their HHI Score.
PowerShares’ and Guggenheim’s merger provides an interesting real-world example. Prior to their merger, their standalone scores (shown above) have them at numbers 17 and 19. If we recalculate their HHI score and measure them as the combined company they are, their HHI score drops from 0.1892 and 0.1486 respectively to a .1226 combined. That moves the combined company down the list to a tie with Northern Trust at number 23, and now better positioned to withstand competitive threats.
A flaw in using this model to evaluate the robustness and fragility of ETF firms is that it doesn’t give us insight as to how a firm became fragile or robust. It’s only a static/point in time measure.
KraneShares is the number one “most fragile” firm according to this score, but they have a good problem. Their largest fund is growing very quickly and causing them to be very concentrated! Most asset managers would be glad to have that problem. Alternatively, WisdomTree, while robust based on our fragility score, would gladly go back to being more fragile if it meant they could regain all the assets they lost from their currency-hedged products — we asked Jeremy Schwartz, and he agreed!
Concluding thoughts on the ETF Industry
For the first 25 years of the ETF industry, if you had ETFs you had an advantage over other asset managers. There was little competition amongst ETF firms. If you were selling investors ETFs you were mainly competing against mutual funds, hedge funds, or futures. With over 2,000 ETFs now listed in the U.S. that has changed. Simply offering a decent investment strategy in an ETF is no longer enough of a differentiator.
Investors can now get transparent, tax-efficient, intraday liquid, low cost, pure beta exposure to almost any asset class or region in the world and are now are asking: What else can you do for me?
Welcome to capitalism!
ETF firms are looking around to figure out what else (or who else) they can offer to bring value to their clients and to better position themselves for the future.
What combinations make sense to you?

References[+]
| ↑1 | Not that either one of them was up for sale/able to be bought last year necessarily as they are both privately owned. |
|---|---|
| ↑2 | Those two companies are great examples of how there’s more than one way to build and grow a successful ETF business. Neither one of them are competing on low cost, and they both have very different distribution strategies: Meb Faber and his team at Cambria are more inbound focused by doing things such as blogging, podcasting, and writing books, while Pacer is more focused on the more traditional route of outbound distribution by seeking out investors in their funds through face to face meetings, cold calling and emailing, reaching into their Rolodexes, etc. But as evidenced by their 100%+ growth in the last year, both can work. |
| ↑3 | The NETFL did not have any players kneel during national anthems this year, but we did have players brought to their knees by VIX trades. |
| ↑4 | Source: http://www.etf.com/sections/etf-league-tables/etf-league-table-2018-04-27 |
| ↑5 | I know there’s a catchier title for this division |
| ↑6 | This data was calculated from 2/21/2018 data on ETF.com. It is possible it has moved since that date: http://www.etf.com/sections/etf-league-tables/etf-league-table-2018-02-21 |
| ↑7 | They are forced to play in two divisions, yes. |
| ↑8 | I’m picturing a meeting of State Street’s executives explaining to their board why the “I’m not fat, I’m top heavy” Division is who they need to target. Let’s make this happen State Street! |
About the Author: Ryan Kirlin
—
Important Disclosures
For informational and educational purposes only and should not be construed as specific investment, accounting, legal, or tax advice. Certain information is deemed to be reliable, but its accuracy and completeness cannot be guaranteed. Third party information may become outdated or otherwise superseded without notice. Neither the Securities and Exchange Commission (SEC) nor any other federal or state agency has approved, determined the accuracy, or confirmed the adequacy of this article.
The views and opinions expressed herein are those of the author and do not necessarily reflect the views of Alpha Architect, its affiliates or its employees. Our full disclosures are available here. Definitions of common statistics used in our analysis are available here (towards the bottom).
Join thousands of other readers and subscribe to our blog.