Each time S&P Dow Jones Indices publishes its latest Active Versus Passive Scorecard, the persistent failure of the vast majority of actively managed funds to outperform is highlighted. The evidence on this failure led Charles Ellis to call active management the loser’s game — while it’s possible to win, the odds of doing so are so poor that it isn’t prudent to try.
What’s more, the evidence even applies to endowments and investors in tax-advantaged accounts, such as IRAs and 401(k) plans, who don’t pay taxes. However, the already poor odds of winning become dramatically worse for taxable investors.
Because dividend and realized capital gains distributions are subject to state, local and federal taxation, for taxable accounts, after-tax returns are the only returns that matter. Despite that, most individual investors remain focused on pretax results. One explanation for this behavior is that investors are unaware of just how devastating an impact taxes can have on returns. Another may be that they are subject to “mental accounting.” Returns they earn go into one pocket, but come April 15, when their accountant hands them the tax bill based on IRS Form 1099 distributions, they pay it from a different pocket, never tying the two together.
In their quest for alpha, the greater turnover of actively managed mutual funds makes them tax inefficient relative to passively managed funds. And the literature provides us with a large body of evidence demonstrating that taxes are often the largest expense taxable investors will face — greater than management fees or fund trading costs. In other words, the quest for pretax alpha can generate negative after-tax alpha.
The Evidence
I’ll begin a review of the literature with the 1993 study, “Is Your Alpha Big Enough to Cover Its Taxes.” Authors Robert Jeffrey and Robert Arnott found that, during the 10-year period they studied, while 21 percent of actively managed funds beat passive alternatives on a pretax basis, just 7 percent did so on an after-tax basis. They concluded: “The preponderance of evidence is so convincing we conclude that the typical approach of managing taxable portfolios as if they were tax-exempt is inherently irresponsible, even though doing so is the industry standard.”
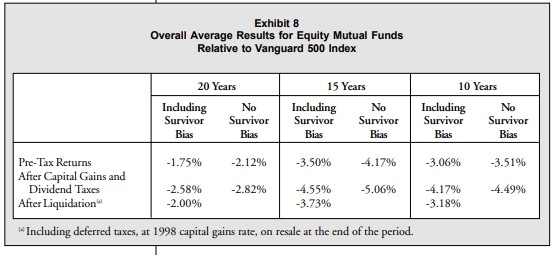
In 2000, Arnott, along with co-authors Andrew Berkin and Jia Ye, followed up with the study “How Well Have Taxable Investors Been Served in the 1980s and 1990s?” The authors investigated the pre- and after-tax efficiency of actively managed funds, the likelihood of pre- and after-tax outperformance, and the relative size of outperformance versus the relative size of underperformance. The following is a summary of their findings:
- The average fund underperformed its benchmark by 1.75 percent per year before taxes and by 2.58 percent on an after-tax basis.
- Just 22 percent of funds managed to beat their benchmark on a pretax basis. The average outperformance was 1.4 percent; the average underperformance was 2.6 percent. However, on an after-tax basis, only 14 percent of funds outperformed. The average after-tax outperformance was 1.3 percent while the average after-tax underperformance was 3.2 percent. The risk-adjusted odds against outperformance were about 17:1. The following table, from Arnott, Berkin and Ye’s study, helps illustrate these results.
The results are hypothetical results and are NOT an indicator of future results and do NOT represent returns that any investor actually attained. Indexes are unmanaged and do not reflect management or trading fees, and one cannot invest directly in an index.
This story is worse than it appears because the data above contains survivorship bias (33 funds disappeared during the time frame covered by the study). Also, because the study only covered funds with more than $100 million in assets, it is likely that the survivorship bias is understated. Funds with successful track records tend to attract assets. Funds with poor records tend to lose assets or close, never reaching the $100 million threshold used in the study.
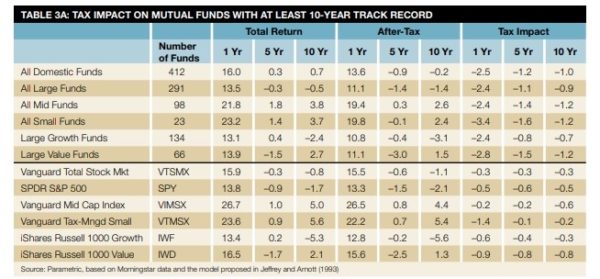
In their 2011 study “Is Your Alpha Big Enough to Cover Its Taxes? Revisited,” Arnott and Berkin, along with Paul Bouchey, updated the aforementioned 1993 paper. They concluded that the typical approach for managing taxable portfolios, acting as if taxes cannot be reduced or deferred, remains the industry standard. Yet, they estimated that the typical active fund needs to generate a pretax alpha of more than 2 percent per year to offset the tax drag from their active strategies — and most cannot accomplish that feat. The finding of a tax drag in excess of 2 percent is consistent with the findings from other studies. The following table is from Arnott, Berkin and Bouchey’s paper.
The results are hypothetical results and are NOT an indicator of future results and do NOT represent returns that any investor actually attained. Indexes are unmanaged and do not reflect management or trading fees, and one cannot invest directly in an index.
Jeffrey Ptak of Morningstar also studied this issue, comparing the after-tax returns of domestic actively managed mutual funds with after-tax returns of comparable Vanguard index funds. His study, which included more than 4,500 funds, covered the 10-year period ending October 2015. The methodology Morningstar used for determining after-tax returns follows SEC guidelines, which are based on the following assumptions: The investor sells the holding at the end of the time period and pays capital gains taxes on any appreciation in price; distributions are taxed at the highest prevailing federal tax-rate and then reinvested; state and local taxes are excluded; only the capital gains are adjusted for tax-exempt funds, because the income from these funds is nontaxable; and the total return is adjusted for the effects of sales loads. A summary of Ptak’s results can be found in the table below.
| Asset Class | Percentage of Actively Managed Funds That Outperformed (%) |
Average Performance Versus Vanguard Index Fund (%) |
Average Annualized Underperformance of the Losers (%) |
Average Annualized Outperformance of the Winners (%) |
| Large Blend | 4.8 | -0.96 | -1.17 | 0.76 |
| Large Growth | 8.7 | -1.01 | -1.61 | 0.95 |
| Large Value | 11.0 | -0.67 | -1.16 | 0.72 |
| Mid Blend | 4.8 | -1.49 | -1.71 | 0.56 |
| Small Blend | 5.4 | -1.45 | -1.70 | 0.65 |
| Small Growth | 7.8 | -1.23 | -1.69 | 0.87 |
| Small Value | 10.2 | -0.93 | -1.37 | 0.90 |
The results are hypothetical results and are NOT an indicator of future results and do NOT represent returns that any investor actually attained. Indexes are unmanaged and do not reflect management or trading fees, and one cannot invest directly in an index.
The success rate calculations in the table don’t contain any survivorship bias (the study assumed any fund which started the period but did not finish the period was a failure), but the average returns are survivorship biased (as there was no 10-year post-tax return to average for the obsolete funds). Thus, the average returns, as well as the returns of the losers, are likely overstated (that is, they are worse than shown).
Note that in not a single case were even 11 percent of actively managed funds able to outperform their Vanguard index fund benchmark on an after-tax basis. What’s more, the average underperformance ranged from -0.67 percent to -1.45 percent (because of survivorship bias, the true level of underperformance, as I alluded to previously, is likely even worse).
Observe that in each case only a small minority of active funds outperformed, and that the margin of outperformance earned by these very few winners was much smaller than the margin of underperformance posted by the much larger number of losers. In other words, the odds of outperforming were not only poor, but the times when funds did outperform, the margin of outperformance tended to be small (from 0.56 percent to 0.95 percent). When a fund lost, the margin of underperformance was much greater (from -1.16 percent to as much as -1.71 percent).
Using the large-blend category as an example, we can calculate the risk-adjusted odds of outperformance. With the 95.2 percent of active funds that underperformed doing so by an average of -1.17 percent, and with the 4.8 percent of active funds that outperformed doing so by an average of 0.76 percent, the risk-adjusted odds of outperformance were 31:1.
The risk-adjusted odds of outperformance for the other categories are: large growth: 18:1; large value: 13:1; mid-blend: 61:1; small blend: 46:1; small growth: 23:1; and small value: 13:1. The average risk-adjusted odds of outperformance when equal-weighting all seven categories were 29:1. Again, keep in mind that because of survivorship bias, the risk-adjusted odds of outperformance are actually worse than these already abysmal figures suggest.
As you consider this data, it’s important to understand that because of the two major bear markets we experienced in the first decade of this century, the impact of taxes on returns over the period that Ptak examined is likely to have been less than the long-term experience.
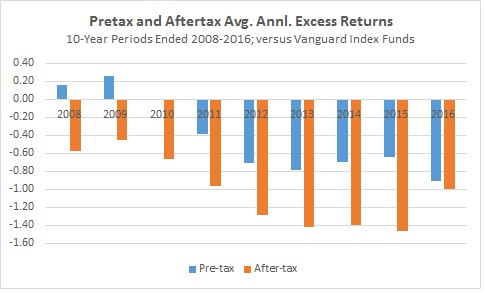
Ptak took another look at this issue in his November 2016 article, “Investing Taxable Money in Active Stock Funds? Bad Idea.” The following figure, which is from that article, shows the pretax and after-tax average annual excess returns of active funds relative to Vanguard’s index funds over 10-year periods ending from 2008 through 2016.
The results are hypothetical results and are NOT an indicator of future results and do NOT represent returns that any investor actually attained. Indexes are unmanaged and do not reflect management or trading fees, and one cannot invest directly in an index.
As you can see, while active equity funds have lagged a comparable Vanguard index fund by about 50-100 basis points per year pretax, that shortfall widened to 1 percent or more after taxes. And this is even before considering survivorship bias in the data.
To address the tax-drag problem, some active fund families have developed funds that focus on tax management. Dale Domain, Philip Gibson and David Nanigian, authors of the study “Is Your Tax-Managed Fund Manager Hiding in the Closet?”, which appeared in the Fall 2015 issue of the Journal of Wealth Management, examined the performance, expense and tax efficiency of domestic equity mutual funds that have a stated goal of minimizing the taxes paid by their shareholders. Their study used the Morningstar database (which includes about 2,000 U.S. equity funds), covering the period from 2010 through 2014, and the Carhart four-factor (market beta, size, value and momentum) model, to compare the returns of tax-managed funds with the returns of both actively managed funds that were not tax managed and index funds and ETFs. The following is a summary of their main findings:
- Consistent with a large body of evidence, on average, over 95 percent of the variability in the returns on these funds is explained by the four common factors in stock returns.
- When compared to their inherently tax-advantaged passively managed counterparts, the tax-managed funds fail to save their investors more money on taxes than their incremental expenses. The results were statistically significant at the 1 percent level in four of the five years.
- There was little difference between the expenses of tax-managed funds and those of their actively managed but not tax-managed counterparts.
The authors also found that in their efforts to more efficiently manage taxes, the tax-managed funds basically became closet indexers — the r-squared figures of the tax-managed funds were higher. In fact, the mean value of the r-squared figures of the tax-managed funds ranged from 0.95 to 0.99 in each year, comparable to the r-squared figures of their passively managed and ETF counterparts. This indicates that there’s really not much security selection effort going on. Yet, their expense ratios are much higher, averaging 1.00 to 1.09 percent a year — indistinguishable from the expense ratios of their non-tax managed counterparts and much higher than the expenses of passively managed funds. In other words, despite charging much higher fees, the tax-managed funds simply follow the index tracking strategies of the lower-cost, passively managed funds. Thus, while in many cases the tax-managed funds did produce lower tax bills than those of the passively managed funds, the savings was much less than the difference in operating expenses.
The tax efficiency argument is even less convincing when compared to ETFs, which are generally more tax efficient than index mutual funds. For example, while the tax alpha between tax-managed funds and ETFs ranged from a savings of 20 basis points to higher costs of 72 basis points, the extra costs ranged from 67 basis points to 73 basis points. The authors concluded that the practical implication is to avoid actively managed, tax-managed funds because they appear to be closet-indexers and fail to offer meaningful tax savings to investors.
Have Active Managers Learned From the Evidence?
Rob Arnott, Vitali Kalesnik and Trevor Schuesler contribute to the literature with their study “Is Your Alpha Big Enough to Cover Its Taxes? A Quarter- Century Retrospective,” which appeared in the Spring 2018 issue of The Journal of Portfolio Management. (Tommi Johnsen did a short summary of this study for Alpha Architect.) The authors noted that the publication of literature on the issue of tax drag has made both investors and managers more aware of the issue. They also noted that there are simple techniques to minimizing the drag of taxes, including:
- Deferral of realization of capital gains, avoiding intentionally taking short-term gains.
- Loss-harvesting.
- Dividend avoidance by waiting to purchase a stock that is about to go ex-dividend.
- Yield management, reducing the tax drag created by dividends.
- Lot selection on sale.
The question is: Are we now seeing different results? The authors used Morningstar’s database, which covered more than 4,000 funds with an average of 10 years of return history per fund. The following is a summary of their findings:
- Disappointingly, active managers still struggle to deliver alpha in excess of their fees and taxes.
- The average actively managed fund that survived the period from 1993 through 2017 lost 1.1 percent of its pretax return (and alpha) to management fees and another 2.4 percent to taxes. That’s a total of 3.5 percent in underperformance after taxes.
- “Smart beta” and other passive funds achieve superior tax efficiency by deferring the realization of capital taxes.
- Both fund size and net outflows have some power in predicting the tax burden, as both tend to increase tax obligations.
- Funds with lower turnover and lower dividend yields tend to be more tax efficient in the future.
The authors concluded:
Tax-sensitive investors are well advised to stay away from active funds that boast frequent trading and claim an ability to capture short-term growth opportunities.
They added:
Historical evidence and common sense suggest that tax-sensitive investors may be better served by avoiding funds touting higher income.
They concluded:
Because most managers pay too much attention to unreliable pretax alpha and too little attention to controllable tax costs, they are destined to fail the investors they serve.
Summary
The evidence against the likelihood of active management generating after-tax alpha is so powerful that even active manager Ted Aronson of AJO Partners (which has about $23 billion in assets under management) had this to say on the subject of taxable investing and active management:
None of my clients are taxable. Because, once you introduce taxes … active management probably has an insurmountable hurdle. We have been asked to run taxable money — and declined. The costs of our active strategies are high enough without paying Uncle Sam. Capital gains taxes, when combined with transactions costs and fees, make indexing profoundly advantaged, I am sorry to say.
Given the evidence, it’s not surprising that most mutual fund managers focus on pretax returns. However, ignoring the impact of taxes on the returns of taxable accounts is one of the biggest mistakes you can make.
Arnott, Kalesnik and Schuesler observed that one of the great ironies is that there are some investors, and even financial advisors, who obsess over a difference in management fees as small as a few basis points, while often ignoring the less obvious costs of taxes and trading costs, which can be an order of magnitude larger. While a fund’s expense ratio is an important consideration, focusing solely on lowest cost, instead of examining the whole picture (including trading costs, fund construction rules, securities lending revenue, the amount of exposure to factors that have demonstrated persistent premiums, and taxes) is a fool’s errand. Perhaps the ETF vehicle can help solve some of the tax issues associated with active equity investments (Alpha Architect’s Wes Gray offers his explanation here), but the ETF wrapper is not a panacea and can’t solve all the tax problems associated with active investing.(1)
About the Author: Larry Swedroe
—
Important Disclosures
For informational and educational purposes only and should not be construed as specific investment, accounting, legal, or tax advice. Certain information is deemed to be reliable, but its accuracy and completeness cannot be guaranteed. Third party information may become outdated or otherwise superseded without notice. Neither the Securities and Exchange Commission (SEC) nor any other federal or state agency has approved, determined the accuracy, or confirmed the adequacy of this article.
The views and opinions expressed herein are those of the author and do not necessarily reflect the views of Alpha Architect, its affiliates or its employees. Our full disclosures are available here. Definitions of common statistics used in our analysis are available here (towards the bottom).
Join thousands of other readers and subscribe to our blog.